
Blog
September 5, 2024

Blog
September 5, 2024

Blog
September 5, 2024
Unlock the full power of Klaviyo’s reporting. Learn to interpret key metrics, benchmark performance, and optimise DTC email & SMS campaigns for growth.
The Importance of Reporting in Klaviyo
In today’s competitive e-commerce landscape, data-driven decision-making is not just an advantage—it’s a necessity. For DTC brands in the fashion, supplements, and F&B industries, effective reporting in Klaviyo plays a crucial role in optimising email and SMS campaigns.
Portfolio reporting allows you to track key performance metrics, identify trends, and make informed decisions that drive revenue and enhance customer retention.
By leveraging Klaviyo’s robust reporting tools, businesses can gain deeper insights into their marketing efforts and fine-tune their strategies to maximise results.
Understanding Klaviyo’s Reporting Tools
Klaviyo provides a suite of reporting tools designed to help DTC brands monitor performance across multiple channels. The platform’s dashboard offers a real-time snapshot of your email and SMS campaigns, while detailed reports allow for deeper analysis of key metrics.
For brands in fashion, supplements, and F&B industries, these tools are invaluable for tracking customer engagement, sales performance, and overall marketing effectiveness. The ability to customise reports and visualise data ensures that you can quickly identify areas of success and opportunities for improvement.
Klaviyo’s Analytics Tab: Maximising the Dashboard, Benchmarks, and Deliverability Tools
1. Dashboard Overview
The Klaviyo Dashboard serves as your marketing command centre, offering a comprehensive view of your key performance metrics. This tool is designed for quick and effective monitoring of your overall marketing performance, enabling you to make real-time adjustments as needed.

Source: Klaviyo
Conversion Summary
Description: The Conversion Summary provides a high-level overview of the effectiveness of your email and SMS campaigns in driving conversions. This summary includes key metrics like placed order rate, revenue generated, and conversion rate, giving you a snapshot of how well your marketing efforts are turning leads into customers.
Usage: Use the Conversion Summary to quickly assess the overall performance of your campaigns and identify areas where you may need to optimise. This section helps you understand the direct impact of your marketing activities on sales, enabling data-driven decision-making to boost conversions.
Key Features:
Flows Revenue Contribution: Flows data encompasses all active, manually triggered, and draft flows that were sent during the selected date range.
Campaigns Revenue Contribution: Campaign data consists of all email and SMS campaign messages that were sent within the chosen date range.


Source: Klaviyo
Campaign Performance
Description: The Campaign Performance section tracks and displays key metrics for your recent email and SMS campaigns. This includes open rates, click-through rates, and conversion rates, allowing you to gauge the effectiveness of each campaign at a glance.
Usage: This section is essential for monitoring how well individual campaigns are performing. By comparing the metrics across different campaigns, you can identify which strategies resonate most with your audience—like those outlined in our 15 Email Marketing Campaign Examples—and refine your approach accordingly.
Key Features:
Open Rates: The percentage of recipients who open your email.
Click-Through Rates (CTR): The percentage of recipients who click on links within your email.
Placed Order Rate: Percentage of recipients who made a purchase after engaging with your emails or SMS.

Source: Klaviyo
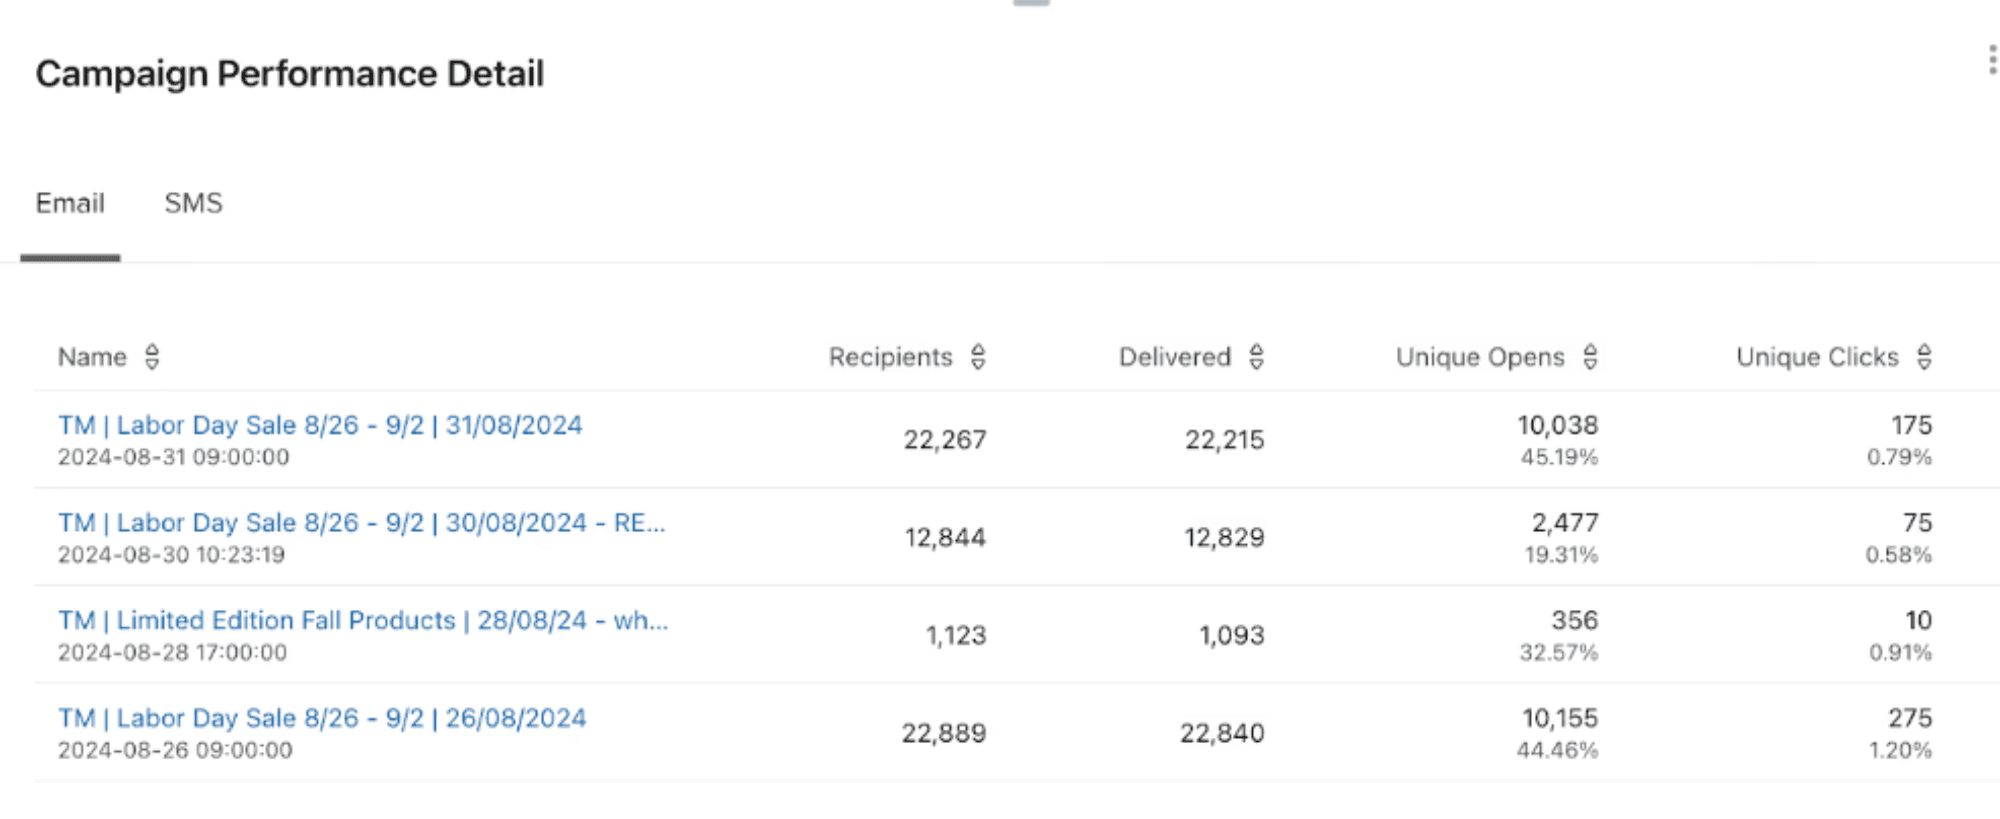
Campaign Performance Detail
Description: The Campaign Performance Detail provides a more granular analysis of each campaign, breaking down performance metrics by segments, links clicked, and revenue generated. It allows you to dig deeper into the specifics of what’s working and what’s not in your email and SMS marketing.
Usage: Use the Campaign Performance Detail to analyse the finer points of your campaign’s success. This can help you identify which segments are most engaged, which content or offers are driving clicks, and where you might need to adjust your strategy for better results.
Key Features:
Recipients: This refers to the total number of emails or SMS messages that were either successfully received or bounced. For SMS, it includes messages that were sent but failed to deliver.
Delivered: This metric indicates the percentage of messages that successfully landed in your subscribers' inboxes or reached their devices.
Unique Opens: This is the number of individual recipients who opened your email or SMS message, divided by the total number of recipients. Keep in mind that SMS opens cannot be tracked.
Unique Clicks: This measures the number of unique recipients who clicked a link within your email or SMS message, compared to the total number of recipients.
Unique Orders: This rate reflects the number of distinct orders placed as a result of your email or SMS campaigns.
Revenue: This metric calculates the total revenue generated from conversions attributed to your campaigns.
Revenue per Recipient (Rev/Rec): This shows the average revenue generated per recipient, calculated by dividing the total revenue from a campaign by the number of successfully delivered messages.

Flows Performance
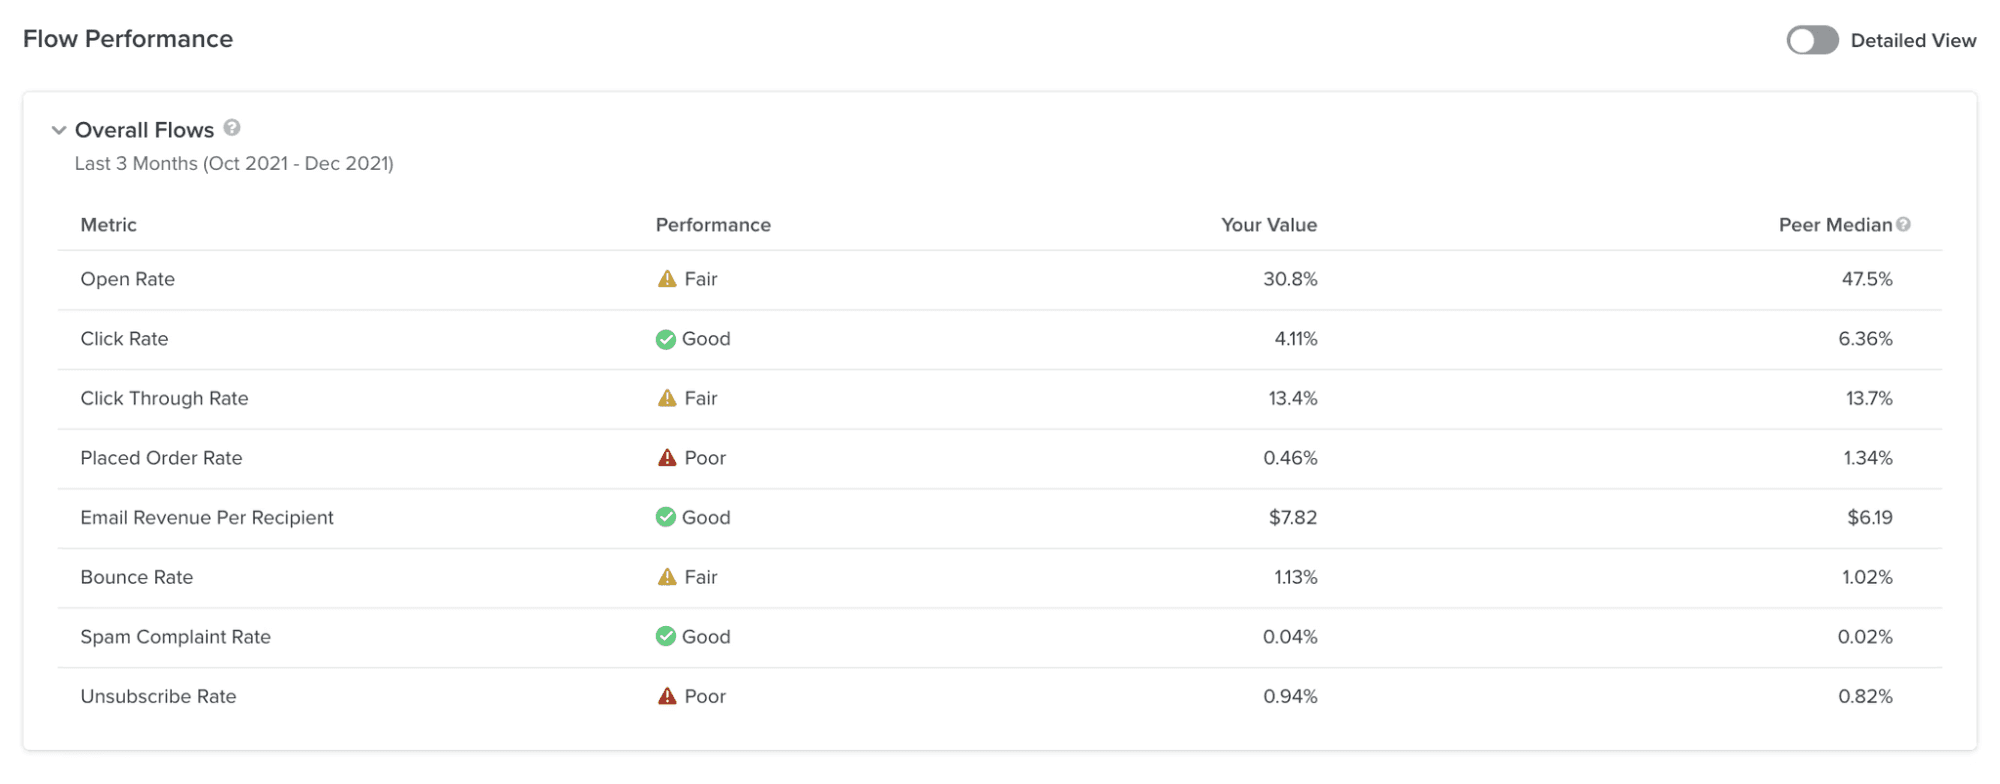
Description: The Flows Performance section tracks the effectiveness of your automated workflows (flows) in Klaviyo, such as welcome series, abandoned cart reminders, and post-purchase follow-ups. It displays key metrics like open rates, click-through rates, and revenue generated by each flow.
Usage: This section is critical for understanding how well your automated flows—such as those outlined in 8 Essential Klaviyo Flows to Boost Customer Loyalty—are performing.By monitoring their performance, you can ensure that your automated marketing efforts are continuously driving engagement and conversions.
Key Features:
Open Rate: The open rate represents the percentage of recipients who opened your email out of the total emails delivered. It is calculated by dividing the number of opens by the total number of delivered emails.
Click Rate: Click rate is the percentage of recipients who clicked on a link in your email, calculated by dividing the total number of clicks by the number of successfully received emails.
Placed Order Rate: The placed order rate measures the percentage of recipients who made a purchase after receiving your message, calculated by dividing the number of orders placed during the attribution window by the total number of unique recipients of that message.
Source: Klaviyo
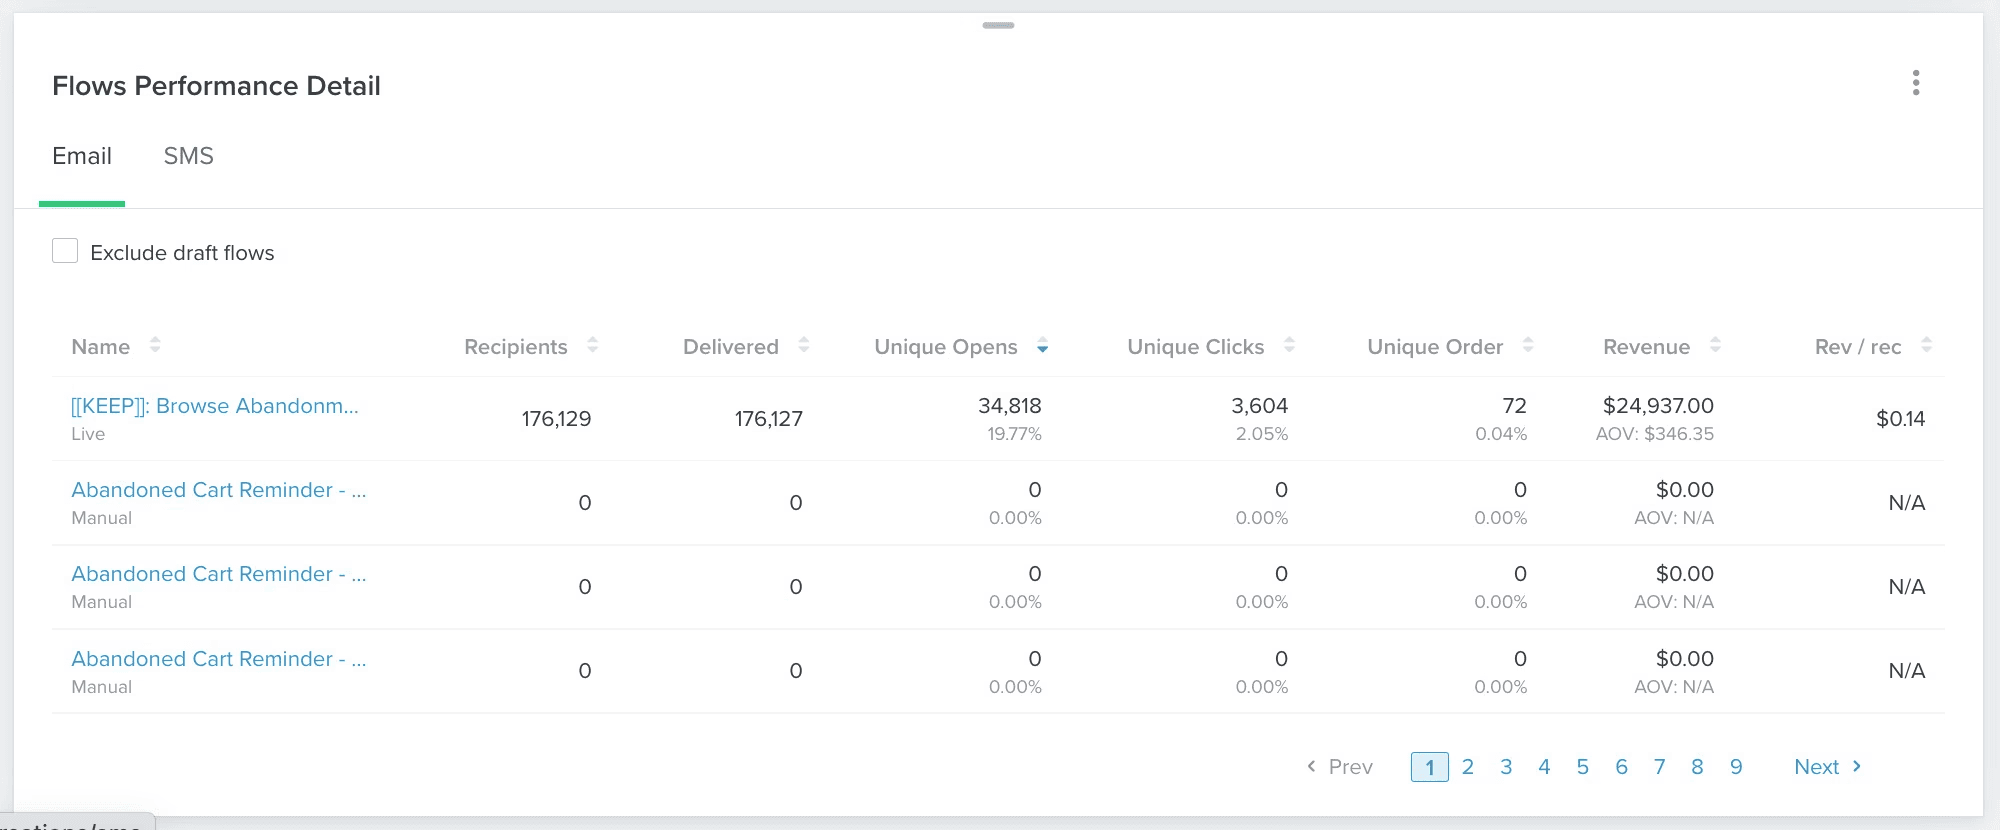
Flows Performance Details
Description: Flows Performance Details offers an in-depth analysis of each flow, similar to the Campaign Performance Detail. This includes breakdowns by step, segment performance, and revenue attribution, providing a comprehensive view of how each flow contributes to your overall marketing goals.
Usage: This detailed analysis is useful for optimising individual steps within your flows. By understanding how each step and segment performs, you can refine your flows to maximise engagement and conversions.
Key Features:
Recipients: This figure represents the total number of emails sent, including both those that were successfully delivered and those that bounced. For SMS, it includes messages that were delivered as well as those that failed to reach recipients.
Delivered: This metric reflects the percentage of flow messages that successfully landed in recipients' inboxes or reached their devices.
Unique Opens: This is the number of individual recipients who opened your email, divided by the total number of recipients. Note that open tracking is not available for SMS messages.
Unique Orders: This metric shows the number of unique orders placed as a direct result of your flows.
Revenue: This figure represents the total revenue generated from conversions that were attributed to your email or SMS flow.
Revenue per Recipient (Rev/Rec): This value indicates the average revenue generated per recipient, calculated by dividing the total revenue by the number of successfully delivered messages in a flow.
Source: Klaviyo
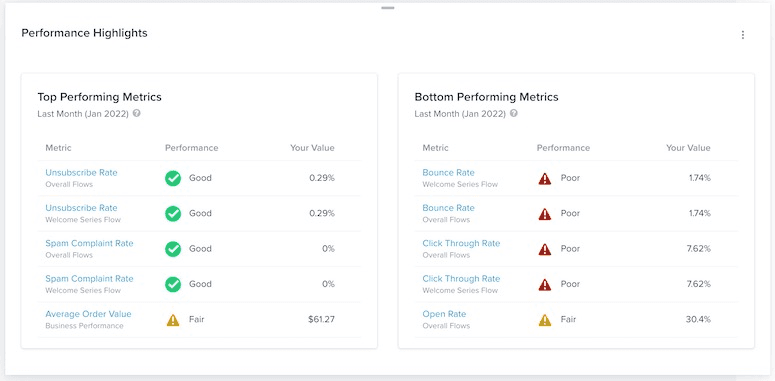
Performance Highlights
Description: The Performance Highlights section summarises the top-performing elements of your marketing strategy, including best-performing campaigns, flows, and emails. It provides a quick overview of what’s driving the most success in your Klaviyo account.
Usage: Use Performance Highlights to quickly identify what’s working best in your marketing efforts. This section is ideal for understanding the high-impact elements of your strategy so you can replicate success in future campaigns.
Key Features:
Top Performing Metrics: Top-performing metrics show strong campaign success; examples are low unsubscribe and spam complaint rates and positive revenue results.
Bottom-Performing Metrics: Bottom-performing metrics highlight areas for improvement; examples are high bounce rates, low click-through rates, and lower engagement levels like open rates.
Source: Klaviyo
Email Deliverability
Description: The Email Deliverability section focuses on the health of your email campaigns, ensuring that your messages reach your audience’s inboxes. This section includes metrics such as bounce rates, spam complaints, and inbox placement.
Usage: Regularly monitor the Email Deliverability section to maintain a strong sender reputation and ensure that your emails are being delivered effectively. Issues like high bounce rates or spam complaints can negatively impact your deliverability—check out our step-by-step deliverability checklist to ensure your emails reach inboxes reliably.
Key Features:
Bounce Rate: The bounce rate is the percentage of emails that failed to be delivered, calculated by dividing the number of bounced emails by the total number of emails sent and received.
Spam Rate: The spam rate measures the percentage of recipients who flagged your email as spam, calculated by dividing the number of spam complaints by the total number of delivered emails.
Unsubscribe Rate: The unsubscribe rate reflects the percentage of recipients who opted out of your email list, calculated by dividing the number of unsubscribes by the total number of emails delivered.

Source: Klaviyo
2. Benchmarks Tab
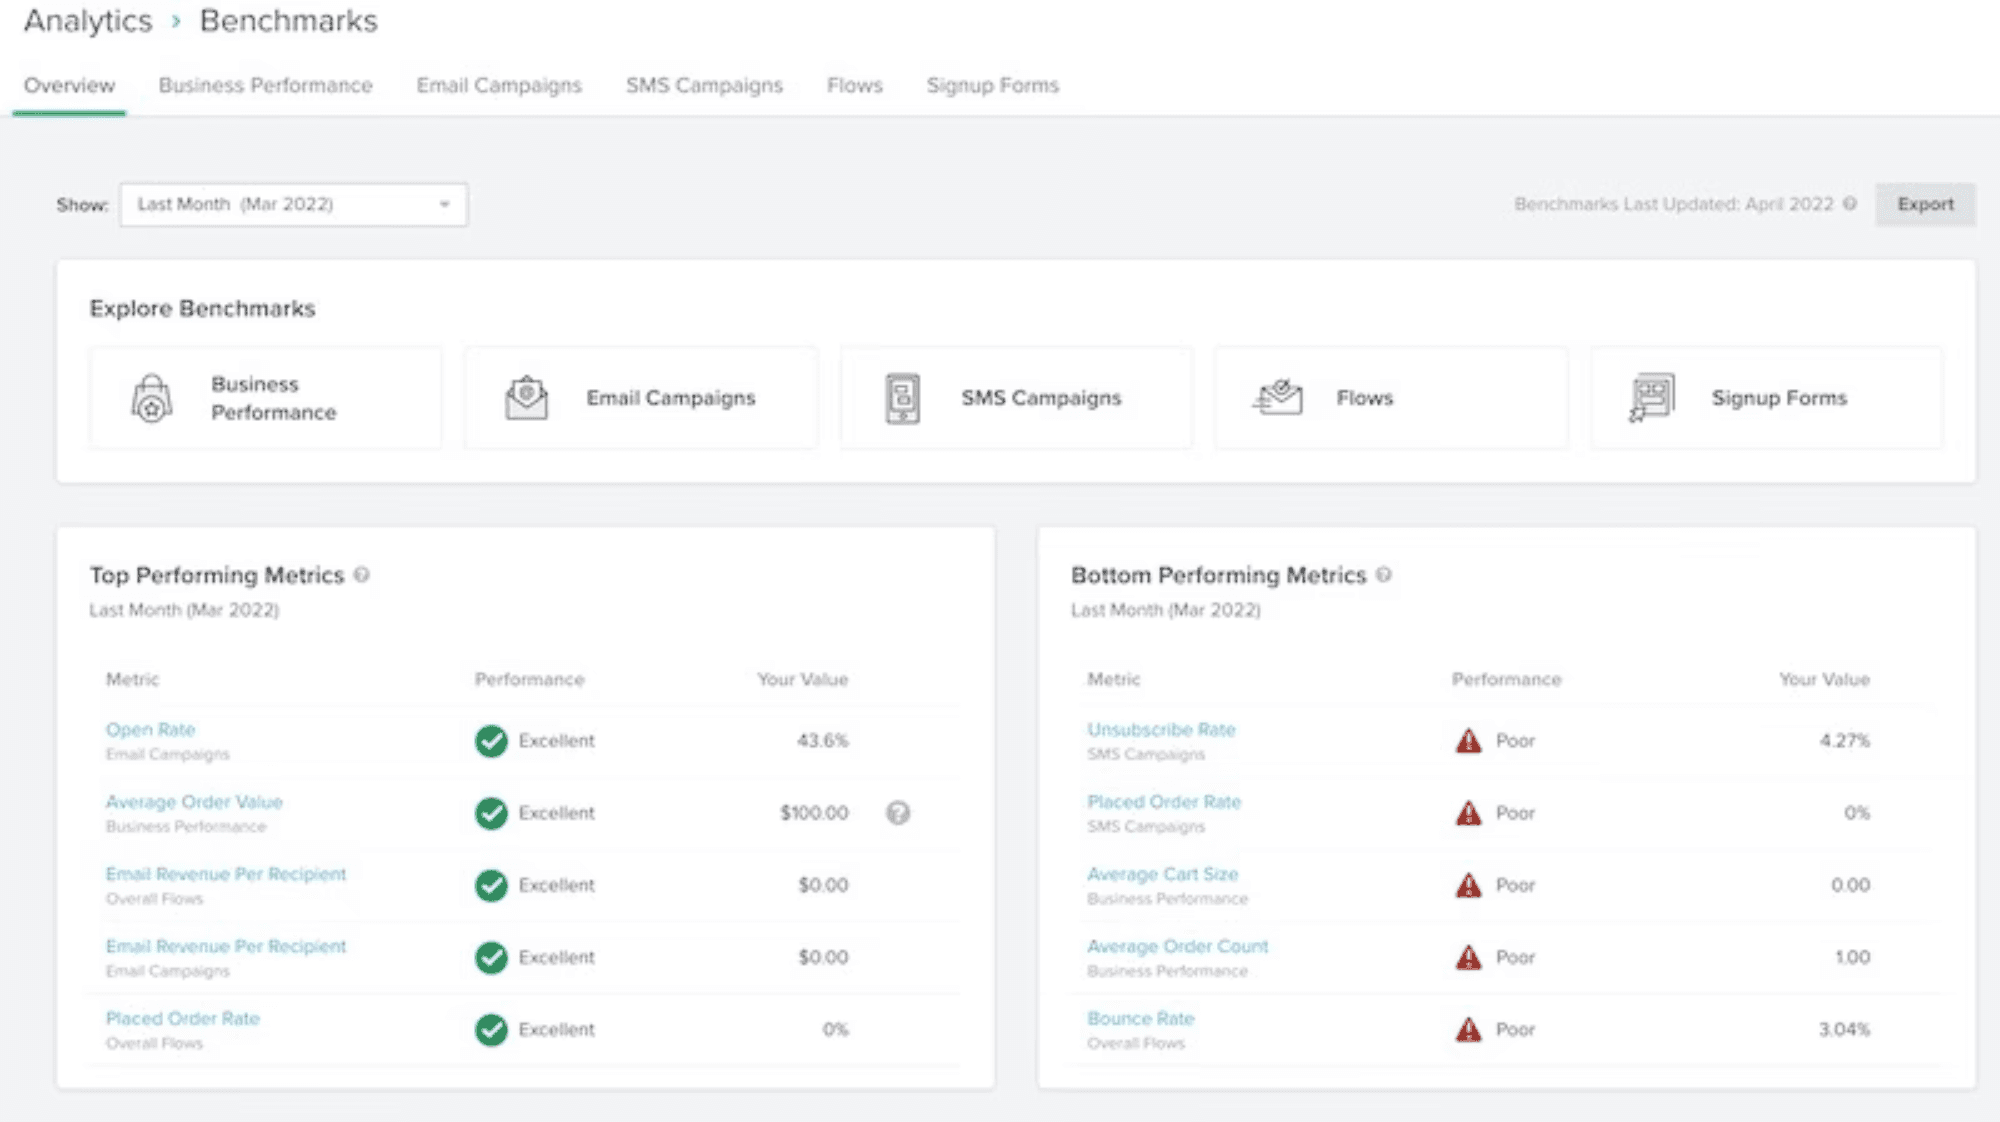
The Benchmark Tab in Klaviyo provides critical insights that allow you to measure your business performance against industry standards. By comparing your performance across key areas such as email campaigns, SMS campaigns, flows, and signup forms, you can identify strengths and areas for improvement.
Overview
Description: The Benchmark Overview gives a snapshot of how your overall business performance compares to similar businesses in your industry. It provides a quick, at-a-glance view of your standing, helping you to understand where you excel and where there’s room for improvement.
Usage: Use this section to gain a high-level understanding of how your business is performing in the market. It helps you quickly assess whether your marketing strategies are competitive and identify any broad areas that need attention.
Key Features:
Industry Comparison: Measures your business metrics against similar businesses within your industry.
Performance Ratings: Assigns ratings (e.g., "Fair," "Good," "Excellent") to different aspects of your marketing efforts based on how you compare to industry standards.
Source: Klaviyo
Business Performance
Description: This section provides a detailed analysis of your business's overall performance, including revenue generation, customer growth, and engagement metrics. It compares these metrics against those of similar companies in your industry.
Usage: This section is vital for understanding the broader success of your business. Regularly reviewing these metrics can help you maintain a competitive edge by ensuring that your business performance meets or exceeds industry standards.
Key Features:
Metric: These are key indicators selected to evaluate your account’s performance, such as open rate, click rate, and repeat customer rate.
Performance: This reflects how well each metric compares to your peer group, rated as poor, fair, good, or excellent. It helps gauge where you stand against industry benchmarks.
Your Value: The actual figure corresponding to your performance metric, such as your average order value in monetary terms.
Your Percentile: Shows how your performance ranks relative to other companies in your peer group, with percentiles indicating your standing (e.g., 75th percentile means you outperform 75% of your peers).
25th Percentile: Represents the performance of companies in the lowest quarter of your peer group.
Peer Median: This is the average performance level of companies in your peer group, where half of the companies perform better and half perform worse.
75th Percentile: This represents the performance of companies in the highest quarter of your peer group, indicating strong performance.


Source: Klaviyo
Email Campaign Performance
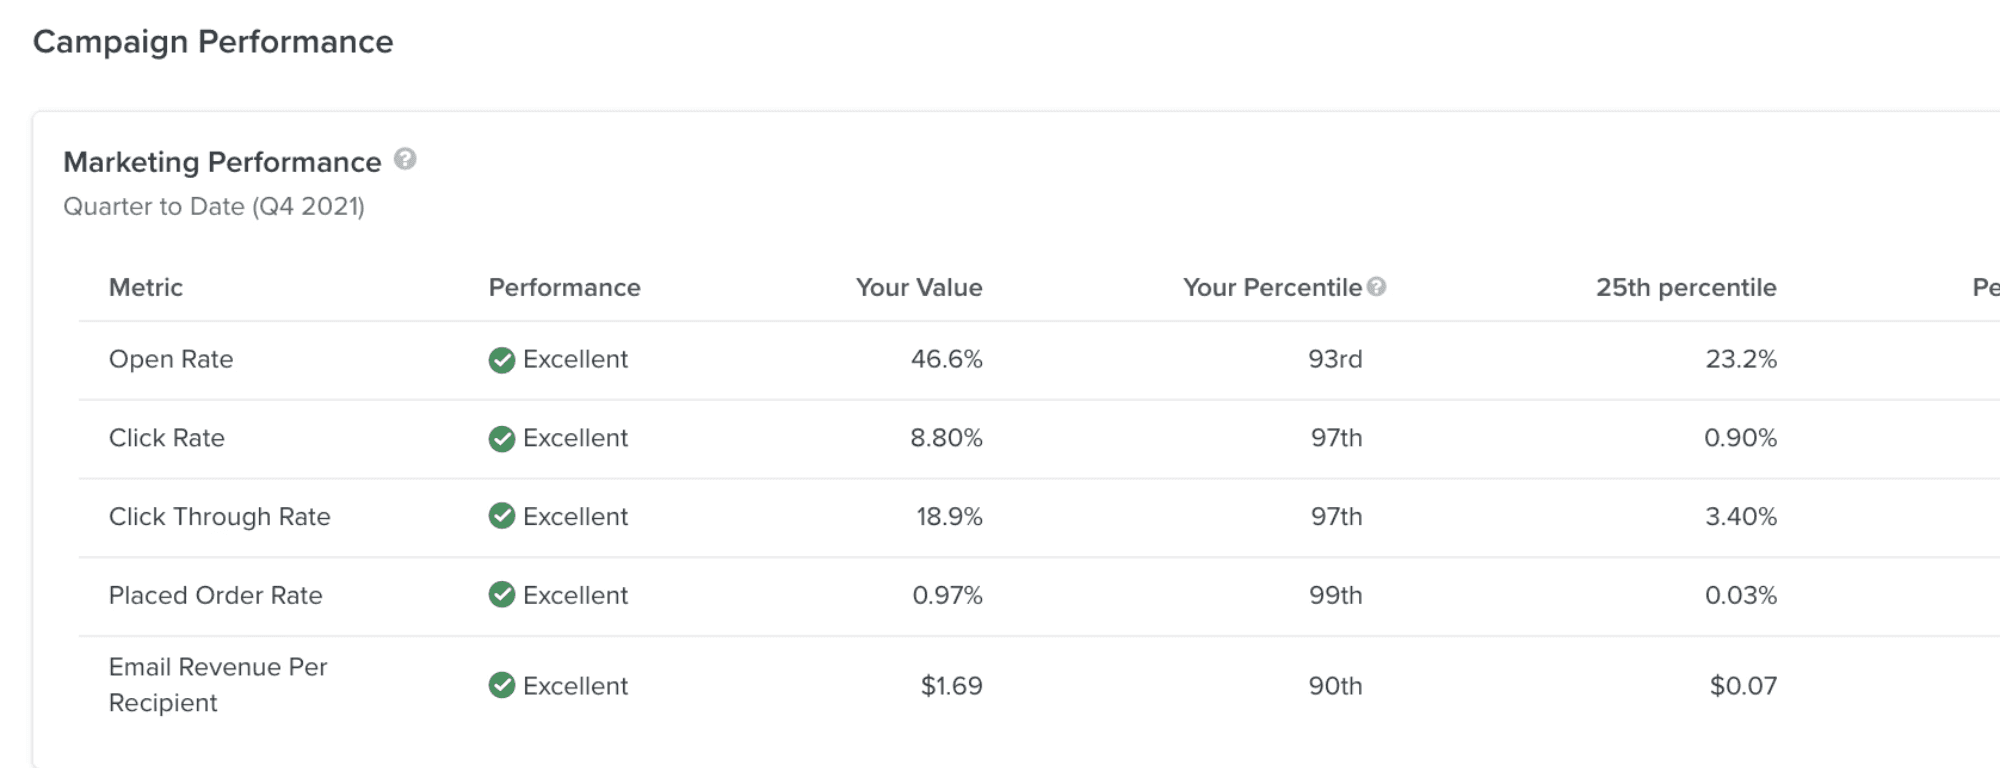
Description: The Email Campaign Performance section provides benchmarks specific to your email marketing efforts. It compares key metrics such as open rates, click-through rates, and conversion rates against industry averages.
Usage: Use this section to pinpoint areas where your email campaigns might be underperforming. Understanding how your email metrics compare to industry averages can guide optimisations that improve overall campaign effectiveness.
Performance indicators and values:
Open Rate: The percentage of recipients who open your email compared to the total number of people who received it.
Click Rate: The percentage of recipients who click a link in your email, based on the total number of emails delivered.
Click-Through Rate: The percentage of recipients who click a link in your email out of those who opened it.
Conversion Rate: The percentage of recipients who place an order after interacting with your email, based on the total number of emails sent.
Email Revenue Per Recipient: The average revenue generated per recipient, calculated by dividing the total email-attributed revenue by the number of people who received an email in a specific time period.
Source: Klaviyo
SMS Campaign Performance
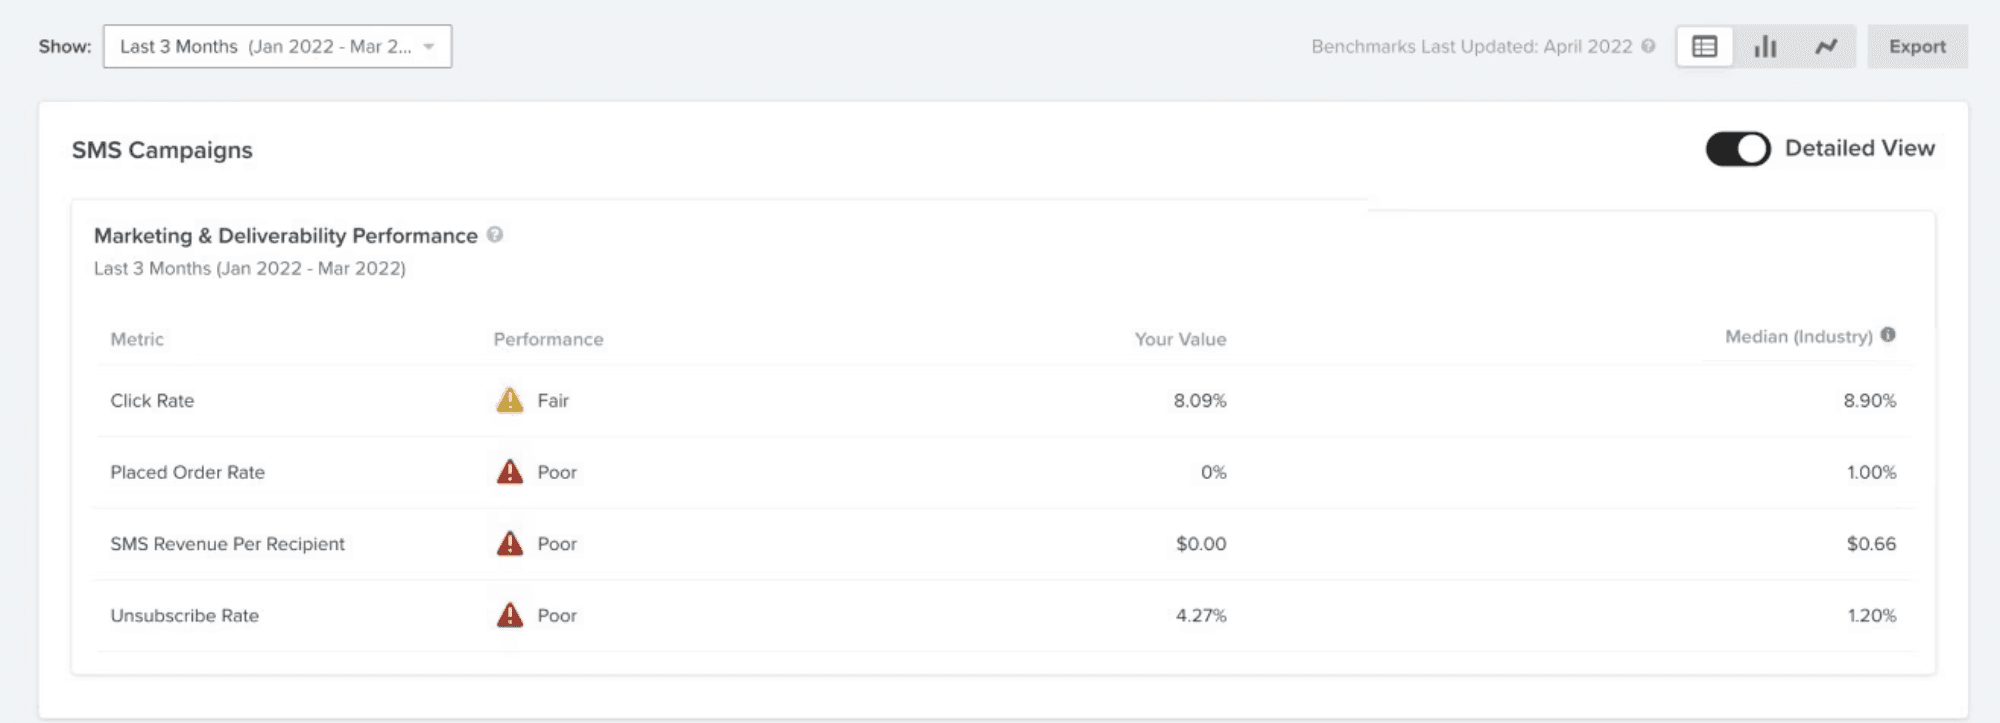
Description: This section focuses on the performance of your SMS marketing campaigns, comparing metrics like engagement rates, click-through rates, and conversion rates against industry standards.
Usage: SMS marketing is increasingly important, especially for DTC brands. This section helps you ensure that your SMS campaigns are competitive and effective, allowing you to make data-driven decisions to enhance your SMS strategy.
Performance indicators and values:
Click Rate: The percentage of recipients who click a link in your SMS, based on the total number of SMS messages delivered.
Placed Order Rate: The percentage of recipients who place an order after clicking a link in your SMS, calculated out of the total number of people who received the SMS.
SMS Revenue Per Recipient: The average revenue generated per recipient, determined by dividing the total SMS-attributed revenue by the number of recipients who received the SMS during a specific period.
Unsubscribe Rate: The percentage of recipients who opt out of your SMS list, based on the total number of SMS messages delivered.
Source: Klaviyo
Flow Performance
Description: The Flow Performance section provides benchmarks for your automated email and SMS flows. It compares the performance of these flows, including open rates, click-through rates, and conversion rates, to industry standards.
Usage: Automated flows are critical for sustained engagement and conversions. Regularly comparing your flow performance against industry benchmarks ensures that your automation strategies are optimised for success.
Key Features:
Metric: The metrics shown reflect your account's performance, such as open rate, click rate, and placed order rate.
Your Performance: Indicates how well your metrics compare to your peer group, categorised as Poor, Fair, Good, or Excellent. For more details on these statuses and tips for improvement, check out the "How to improve your benchmark results" guide.
Your Value: This represents the actual figure associated with a specific performance metric, such as the exact average order value for your business.
Median (Peers): This is the performance value of companies in the middle range, where half perform better and half perform worse than the median.
Performance indicators and values:
Open Rate: The percentage of recipients who open your email out of the total number of emails delivered.
Click Rate: The percentage of recipients who click a link in your email, based on the total number of emails received.
Click-Through Rate: The percentage of recipients who click a link in your email out of those who opened it.
Conversion Rate: The percentage of recipients who make a purchase after engaging with your email, calculated from the total number of people who received the email.
Email Revenue Per Recipient: The average revenue generated per email recipient, calculated by dividing the total revenue attributed to email by the number of recipients within a given timeframe.
Spam Report Rate: The percentage of recipients who mark your email as spam out of the total number of people who received it.
Unsubscribe Rate: The percentage of recipients who opt out of your email list, based on the total number of emails delivered.
Bounce Rate: The percentage of emails that fail to be delivered (bounced) out of the total number of emails sent.

Source: Klaviyo
Signup Forms Performance
Description: The Signup Forms Performance section benchmarks the effectiveness of your forms in converting visitors into subscribers. It compares metrics such as conversion rates and growth rates against those of similar businesses.
Usage: Optimising your signup forms is crucial for growing your email list. This section helps you understand how well your forms are performing compared to industry benchmarks—see our Top 8 Klaviyo Pop-Up Form Strategies to maximise conversion potential.

Source: Klaviyo
3. Deliverability Tab
Klaviyo’s Deliverability Tab provides essential insights into the health of your email campaigns, ensuring that your emails reach your audience effectively. This section is broken down into three key components: Score, Reports, and Bounce Details.
Score
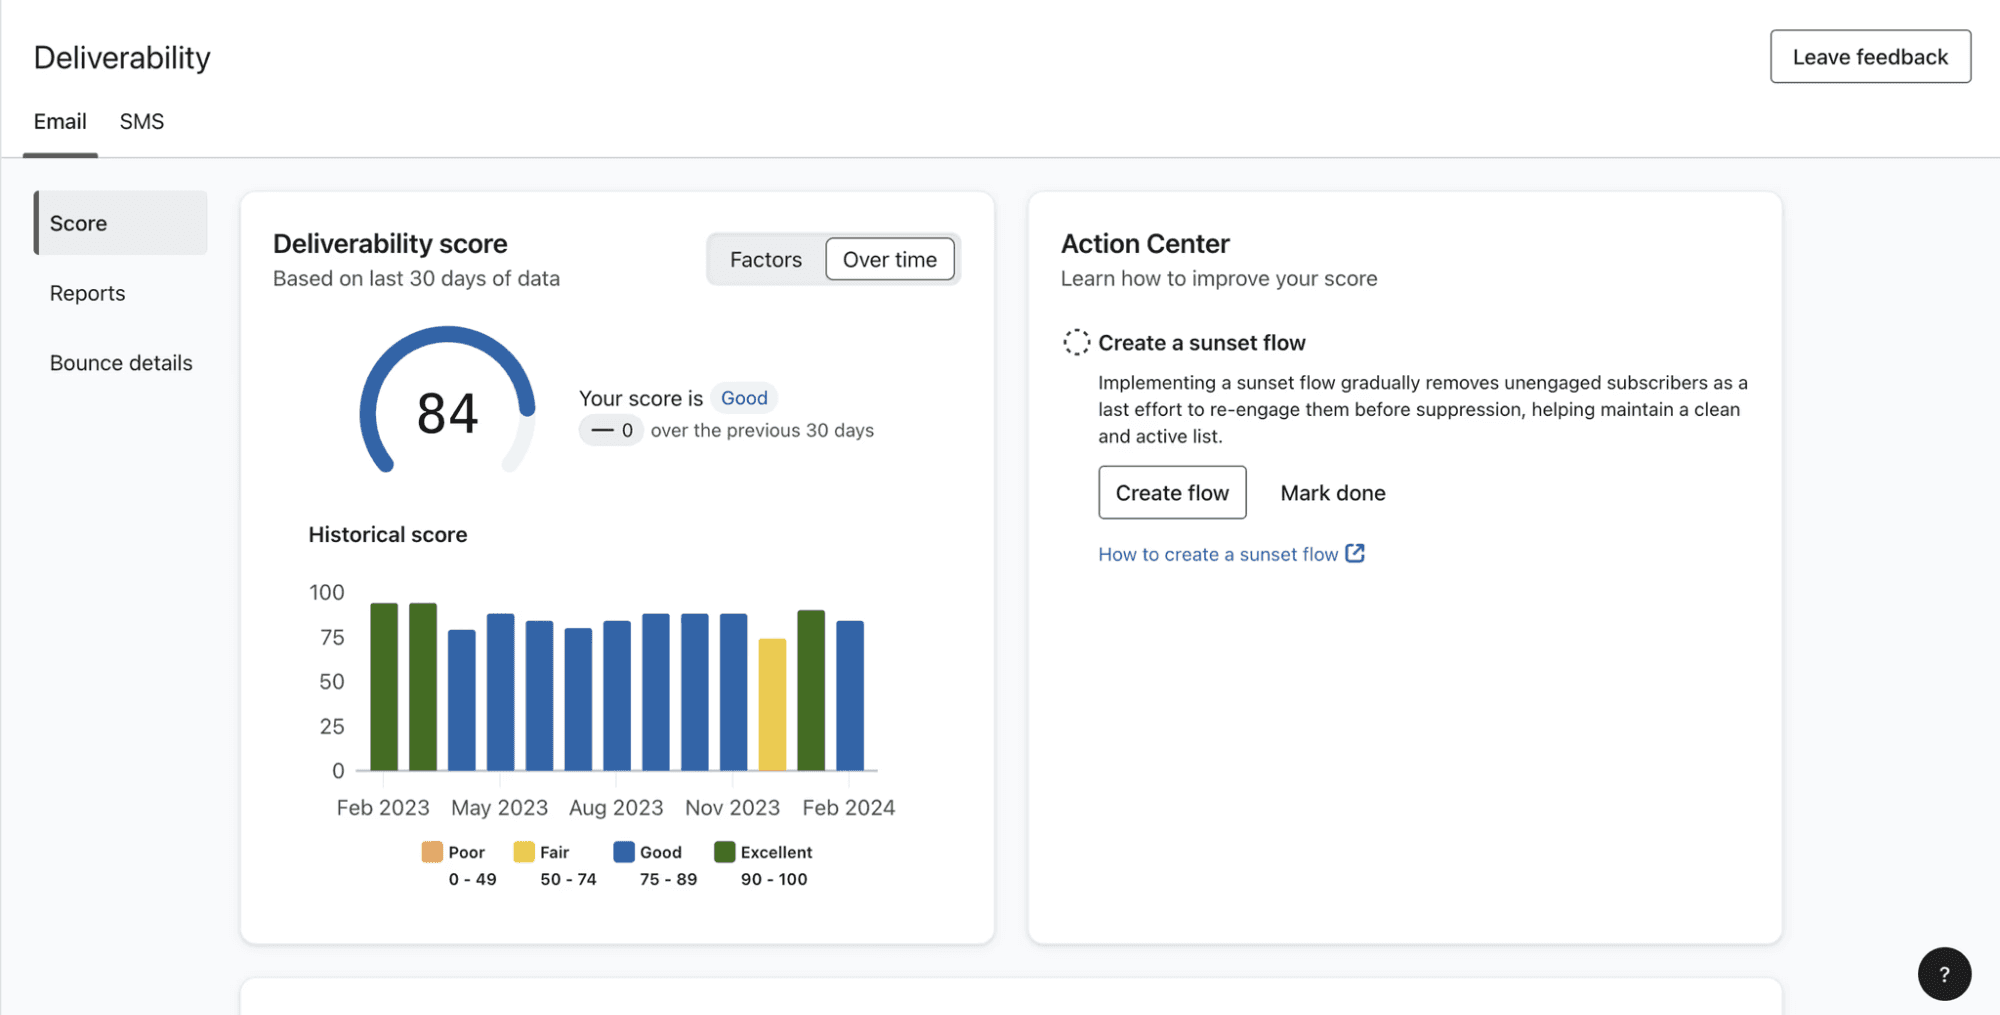
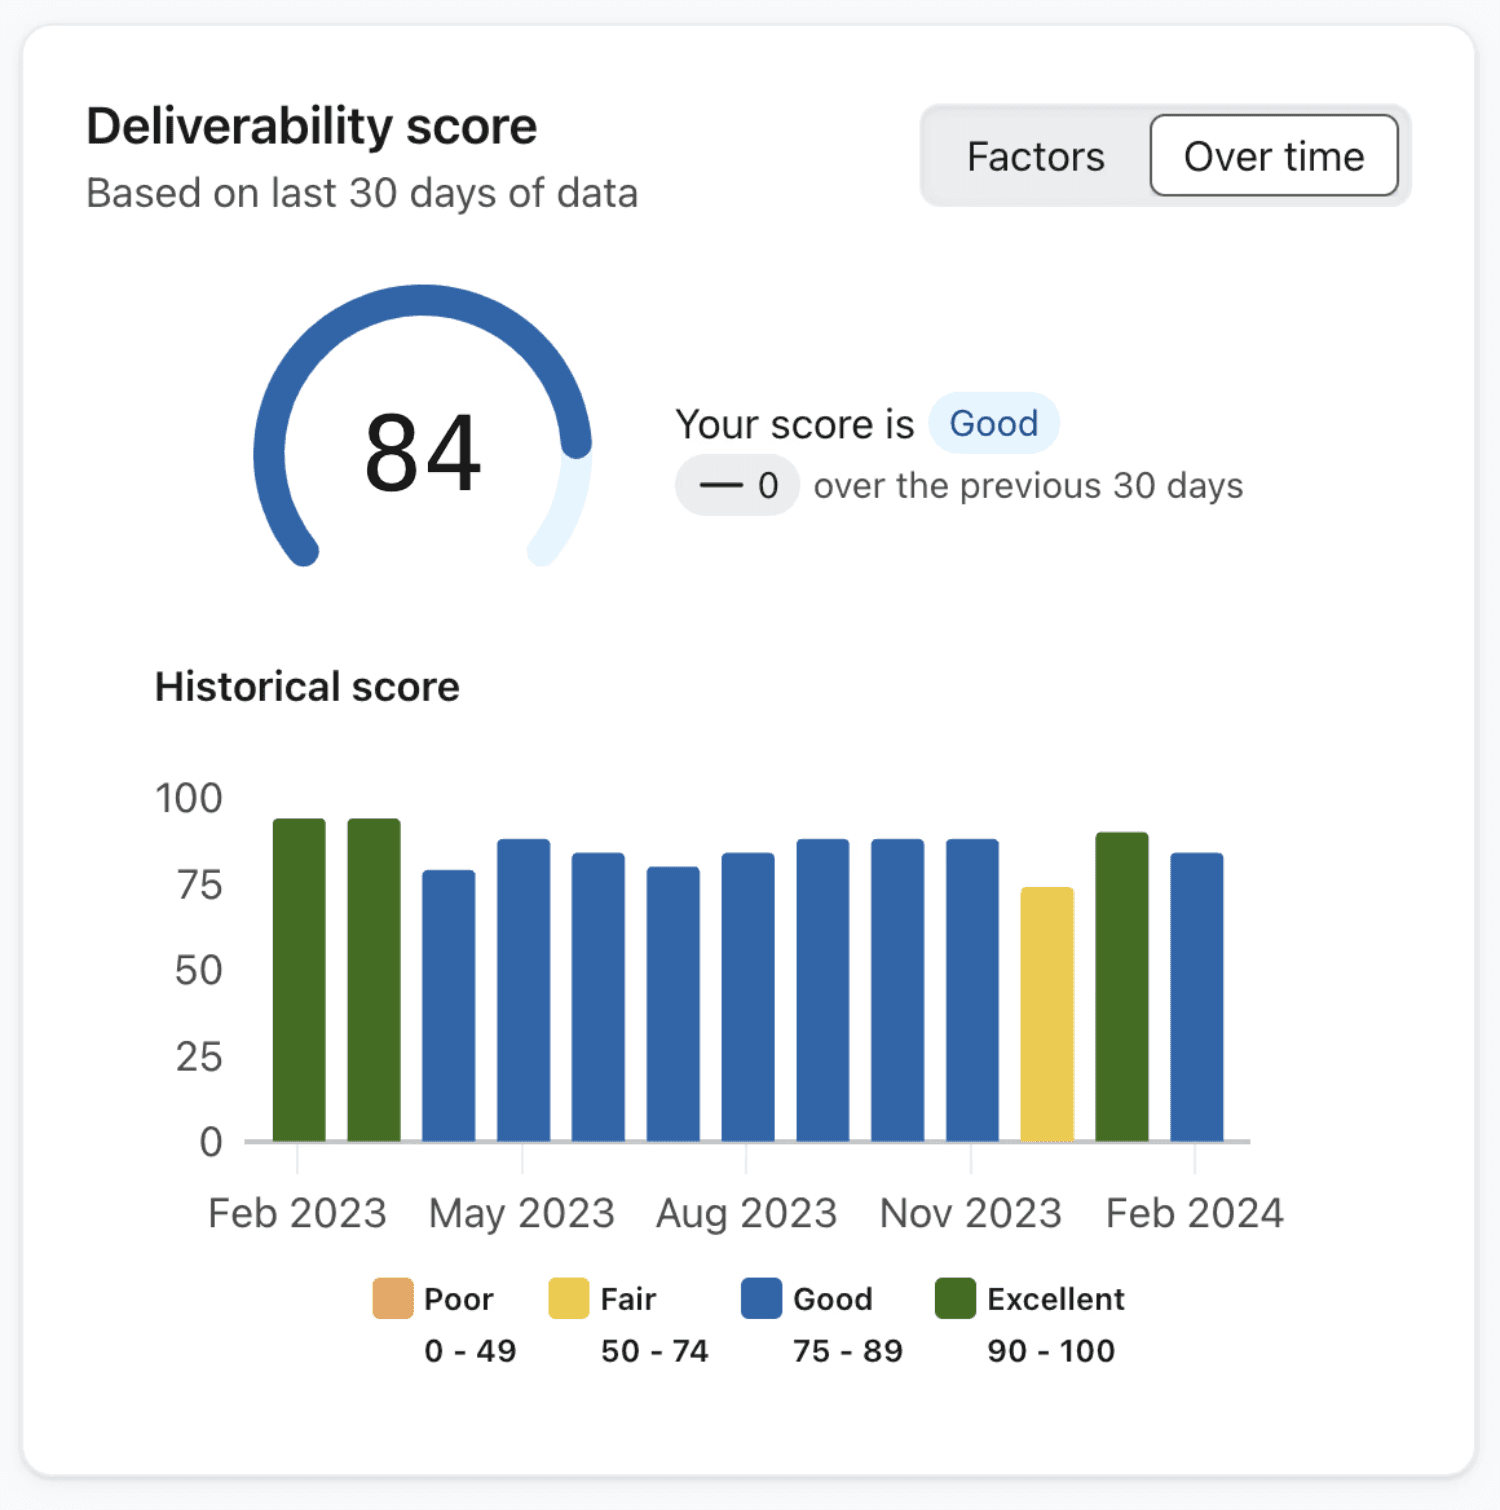
Description: The Score section gives you an overall deliverability score, which serves as an indicator of how well your emails are performing in terms of deliverability. This score takes into account various factors like bounce rates, spam complaints, and inbox placement to provide a comprehensive view of your sender reputation.
Usage: Regularly monitoring your deliverability score allows you to maintain a strong sender reputation. A high score suggests that your emails are reaching inboxes effectively, while a lower score indicates potential issues that need to be addressed to prevent emails from landing in spam folders.
Key Features:
Deliverability Score: A composite score based on multiple deliverability factors such as bounce rates, spam complaints, and engagement metrics.
Reputation Indicators: Highlights specific areas that are positively or negatively impacting your score.
Source: Klaviyo
Reports
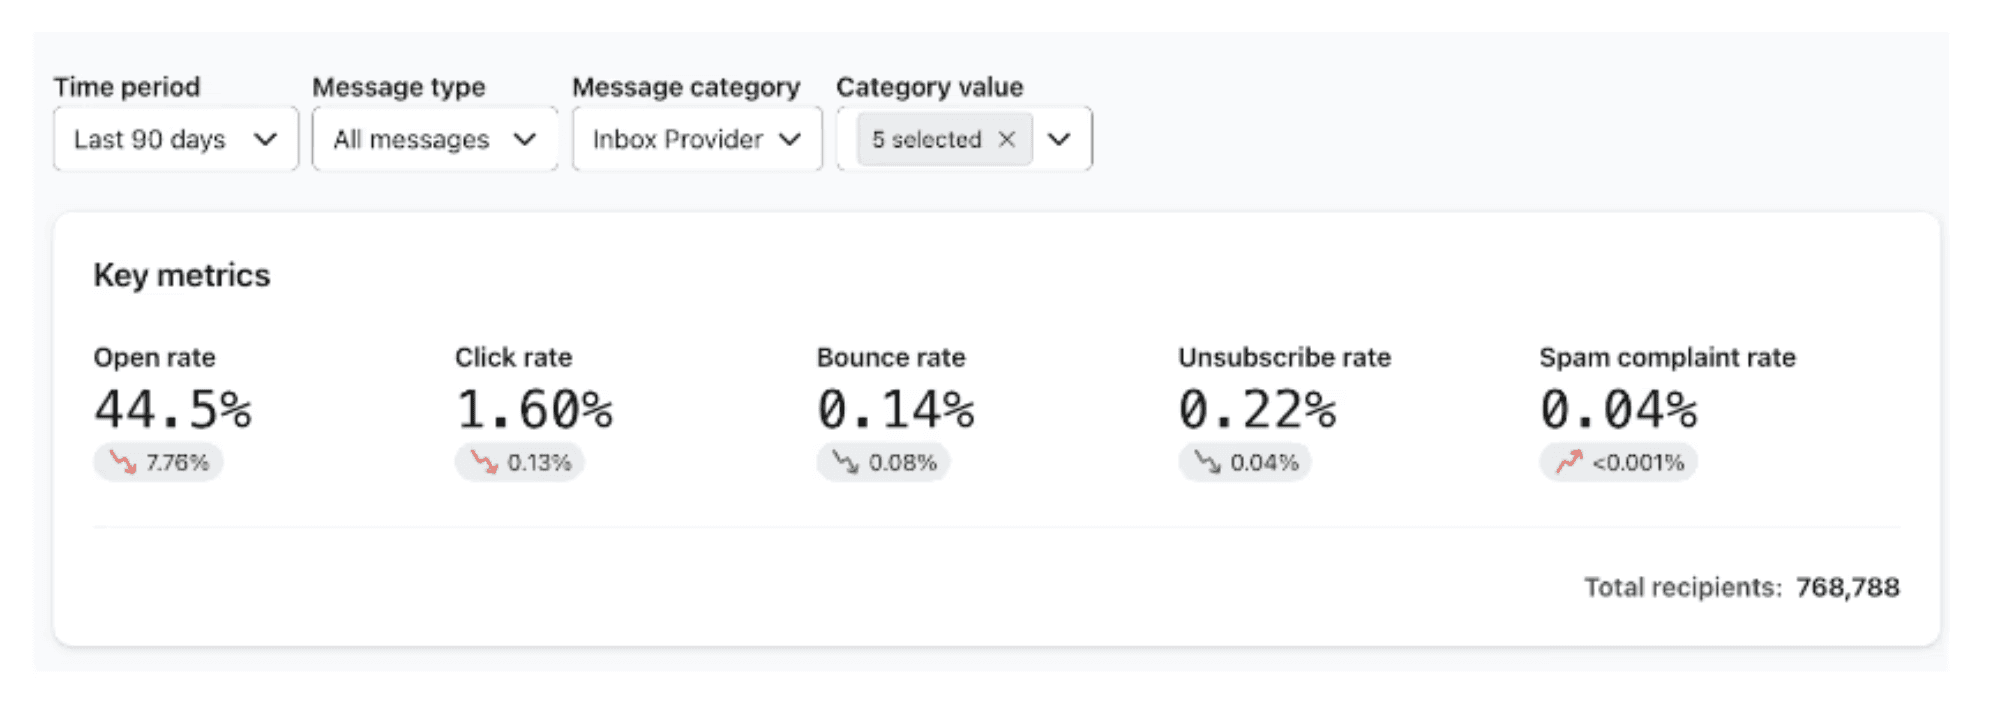
Description: The Reports section offers detailed insights into the performance of your email campaigns over time, focusing specifically on deliverability metrics. It provides data on how your emails are being received by your audience, including inbox placement, spam rates, and engagement.
Usage: This section is crucial for understanding the specific factors that affect your email deliverability. By reviewing these reports, you can identify trends and potential issues, such as increasing spam complaints or declining inbox placement, allowing you to take corrective action before they impact your overall campaign performance.
Key Features:
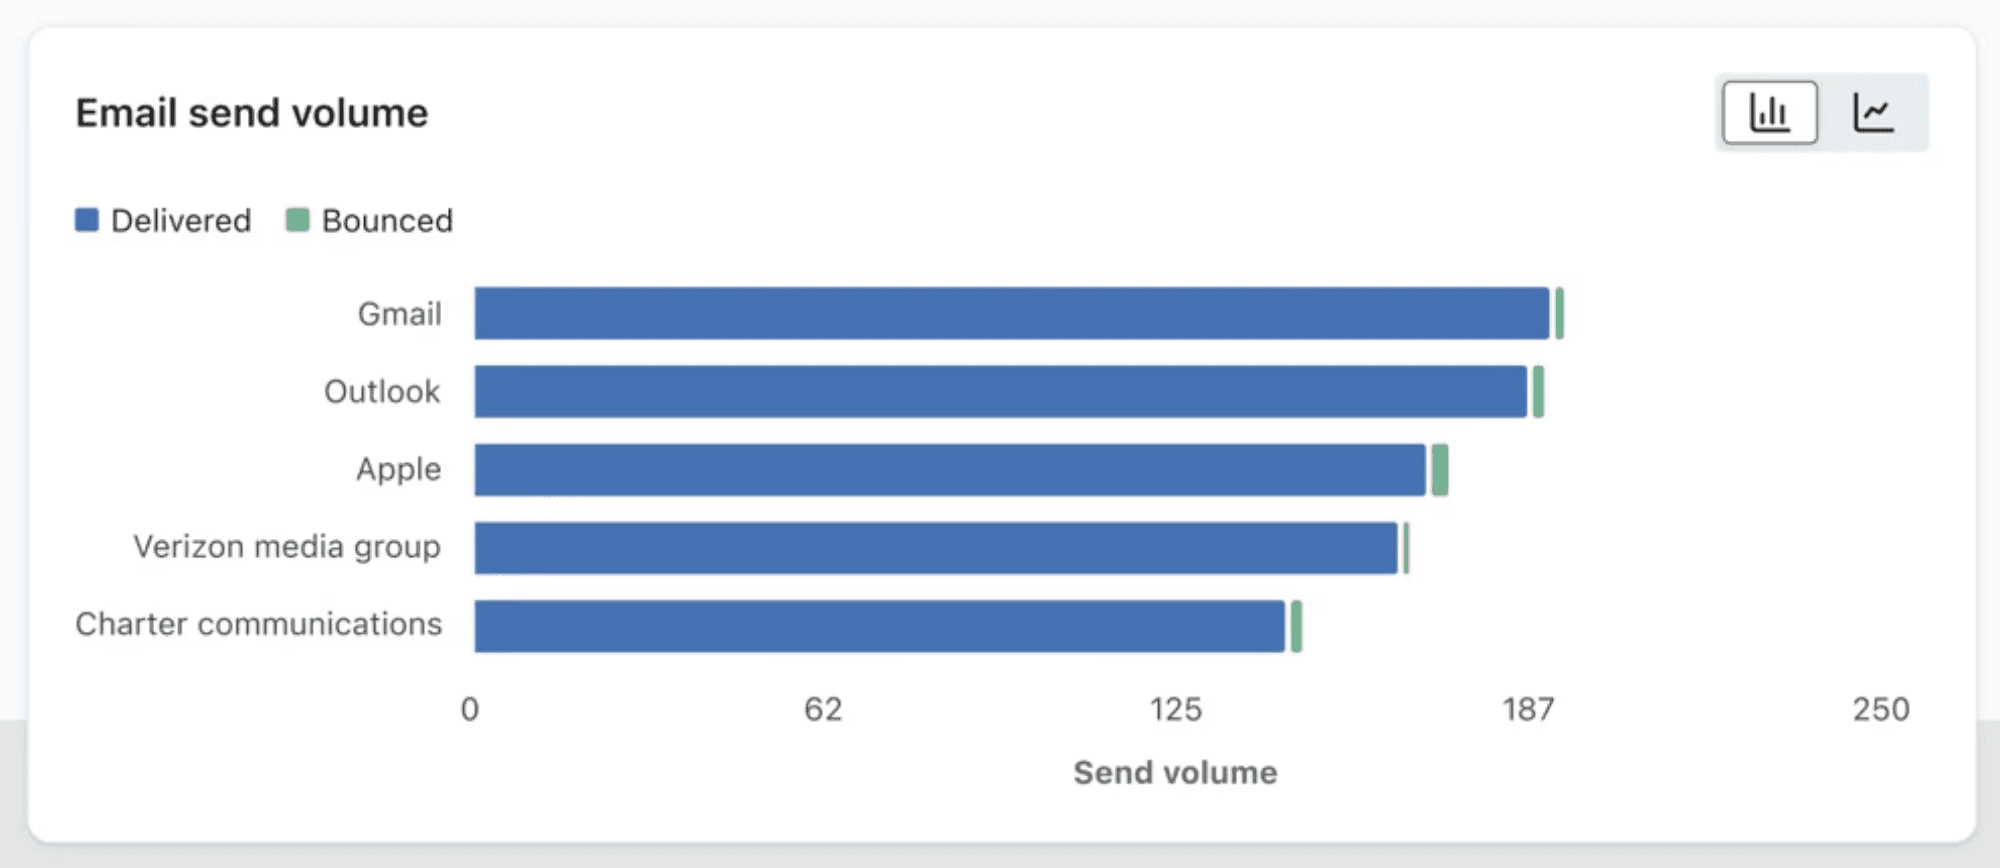
Email Send Volume: The Email Send Volume report provides a breakdown of both delivered and bounced emails, focusing on the top 5 email domains or inbox providers with the highest number of sent emails.
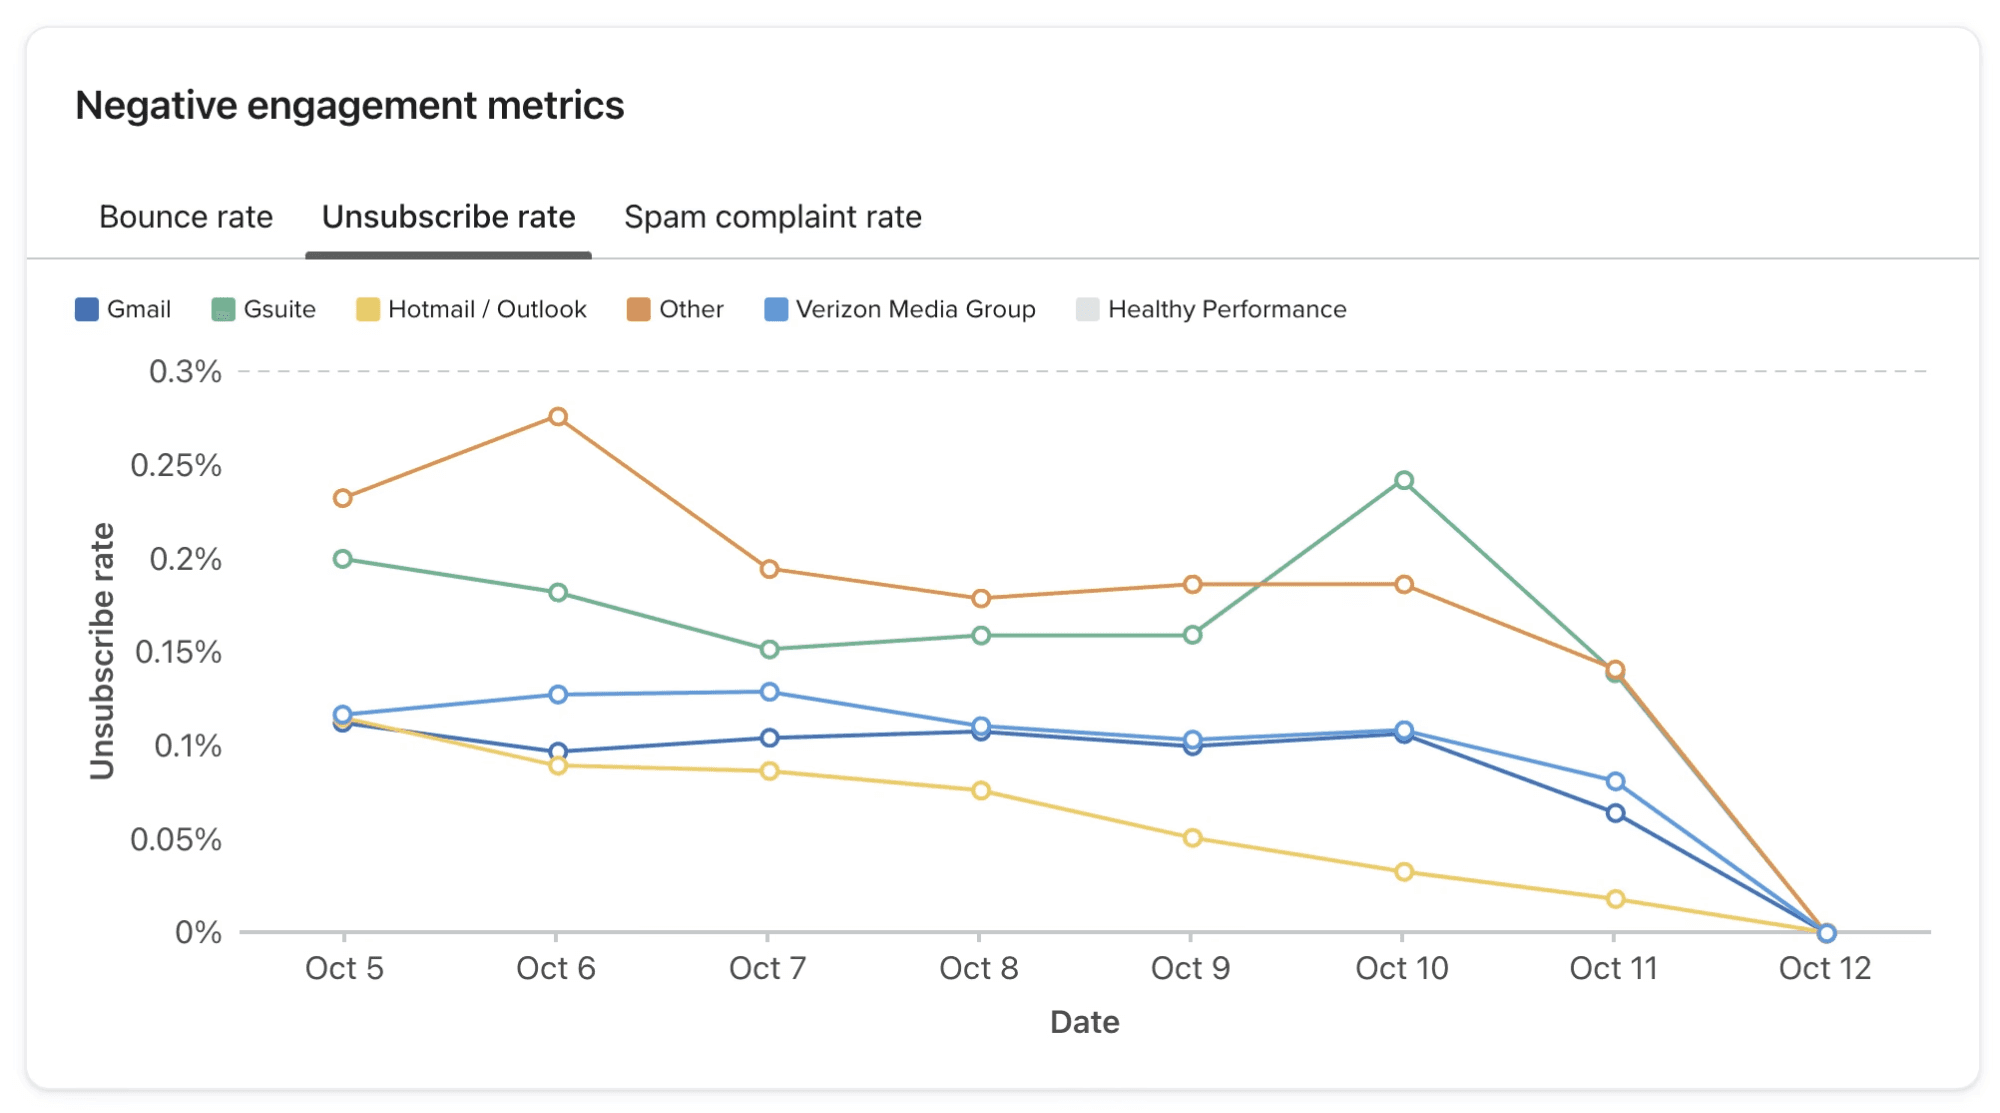
Negative Engagement Metrics: The Negative Engagement Metrics chart displays the rates of negative interactions, such as bounces or spam reports, across the top 5 email domains or inbox providers with the most sent emails on your account.
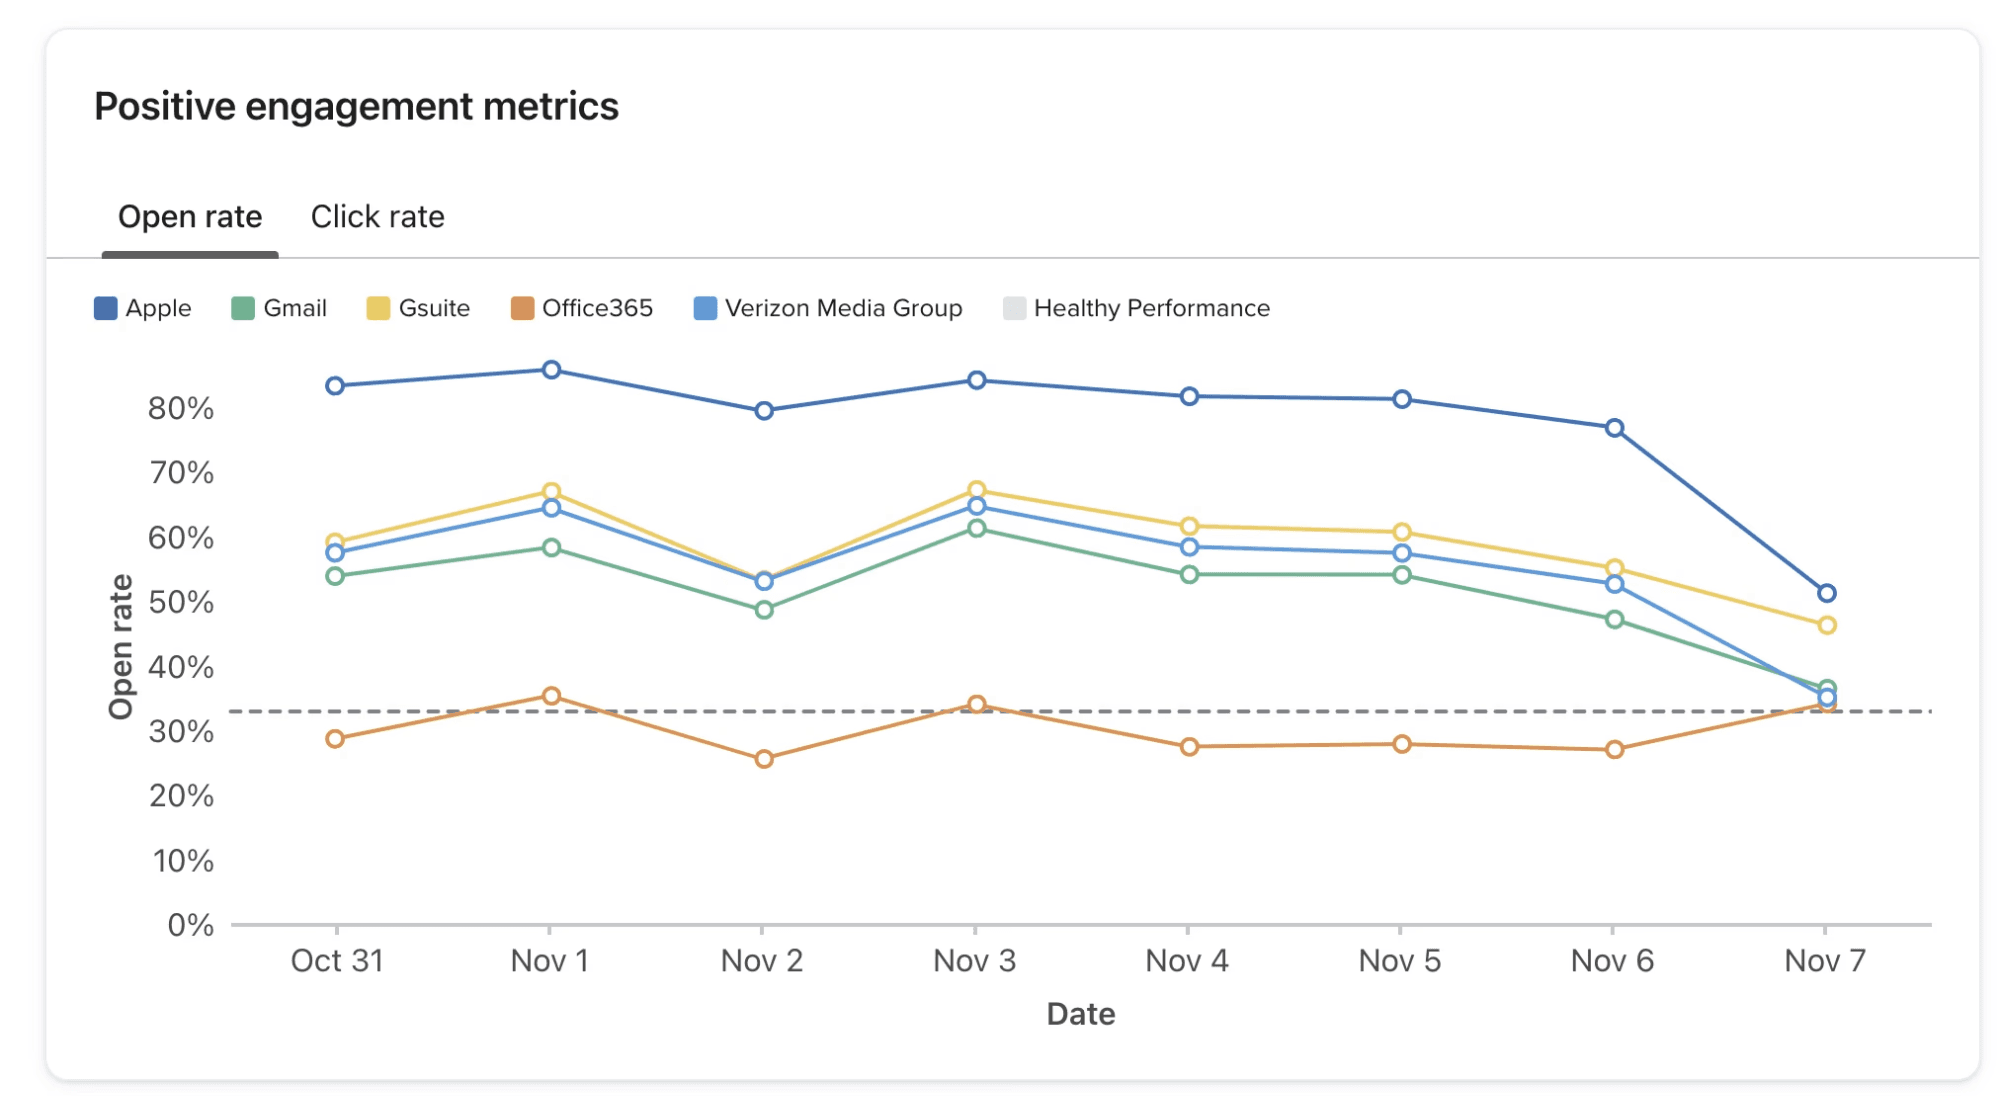
Positive Engagement Metrics: The Positive Engagement Metrics chart highlights the rates of favourable interactions, like opens and clicks, for the top 5 email domains or inbox providers with the highest email send volume.
Source: Klaviyo
Bounce Details
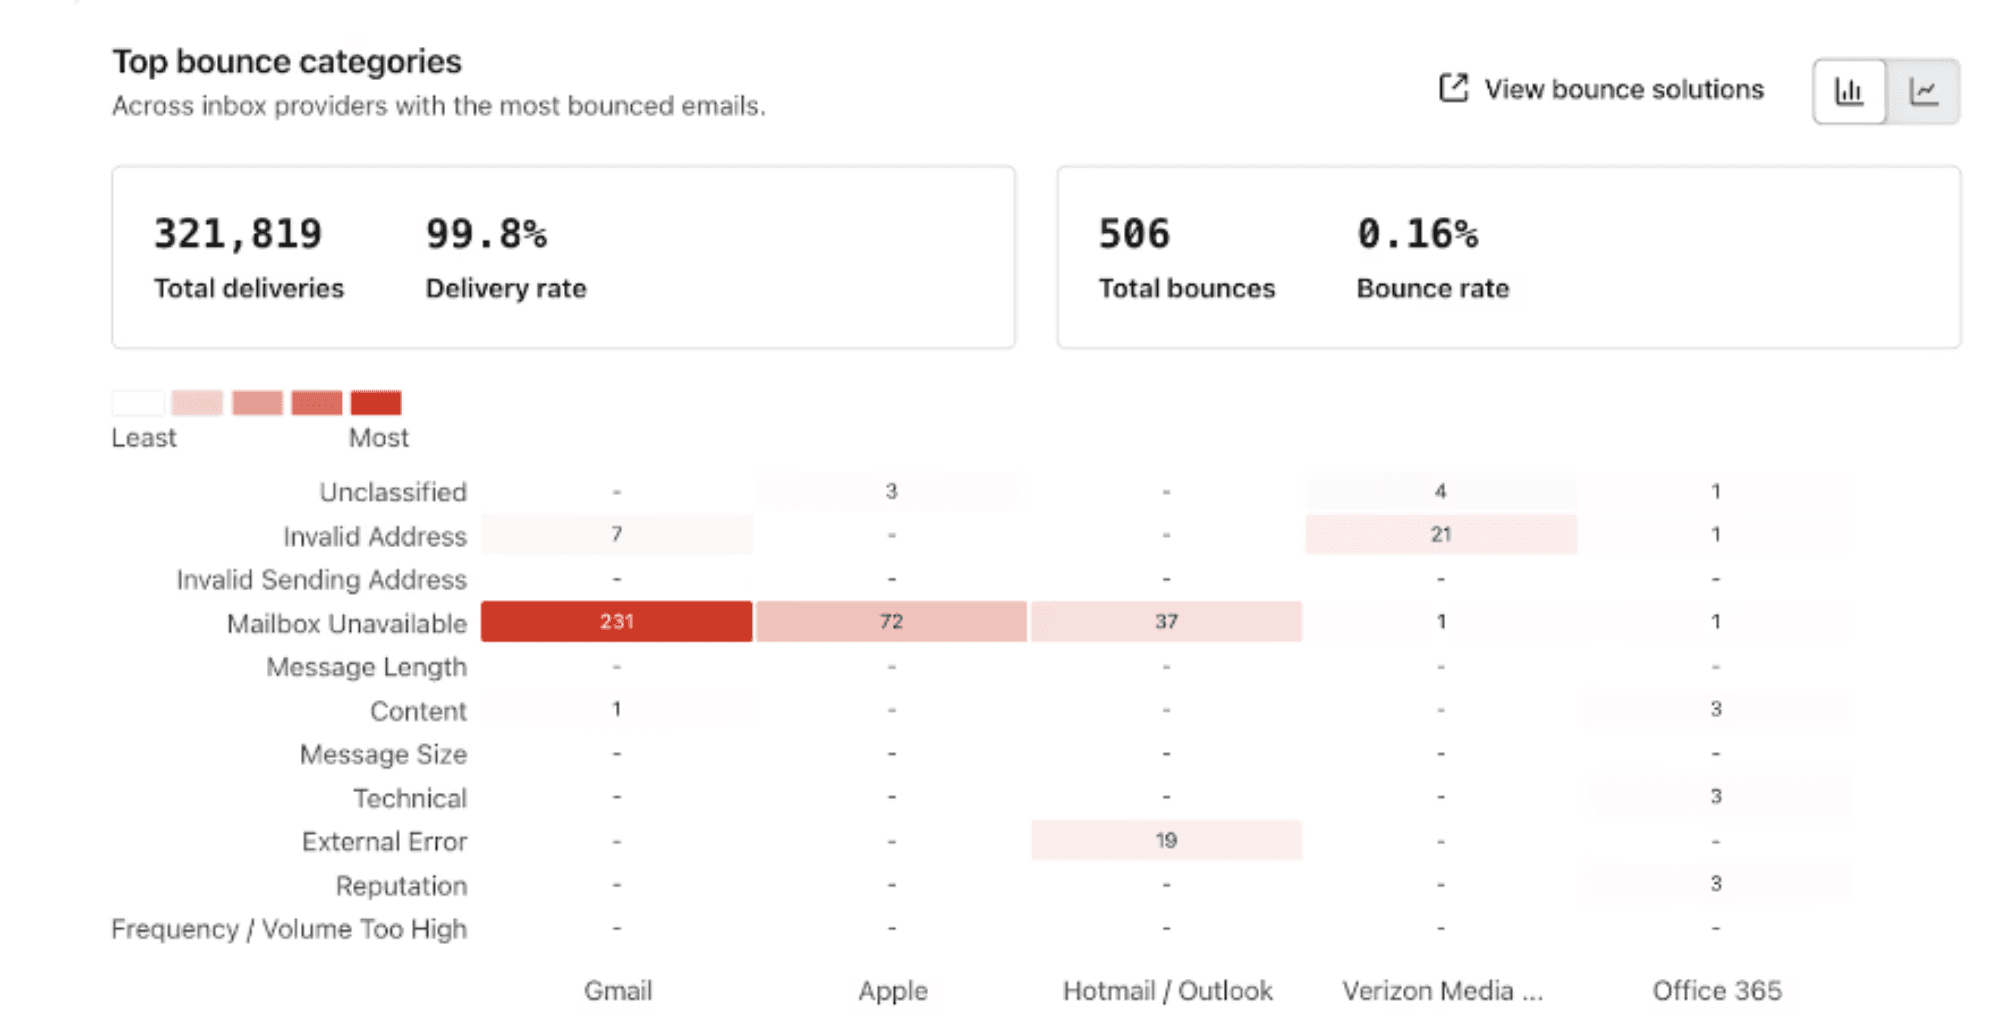
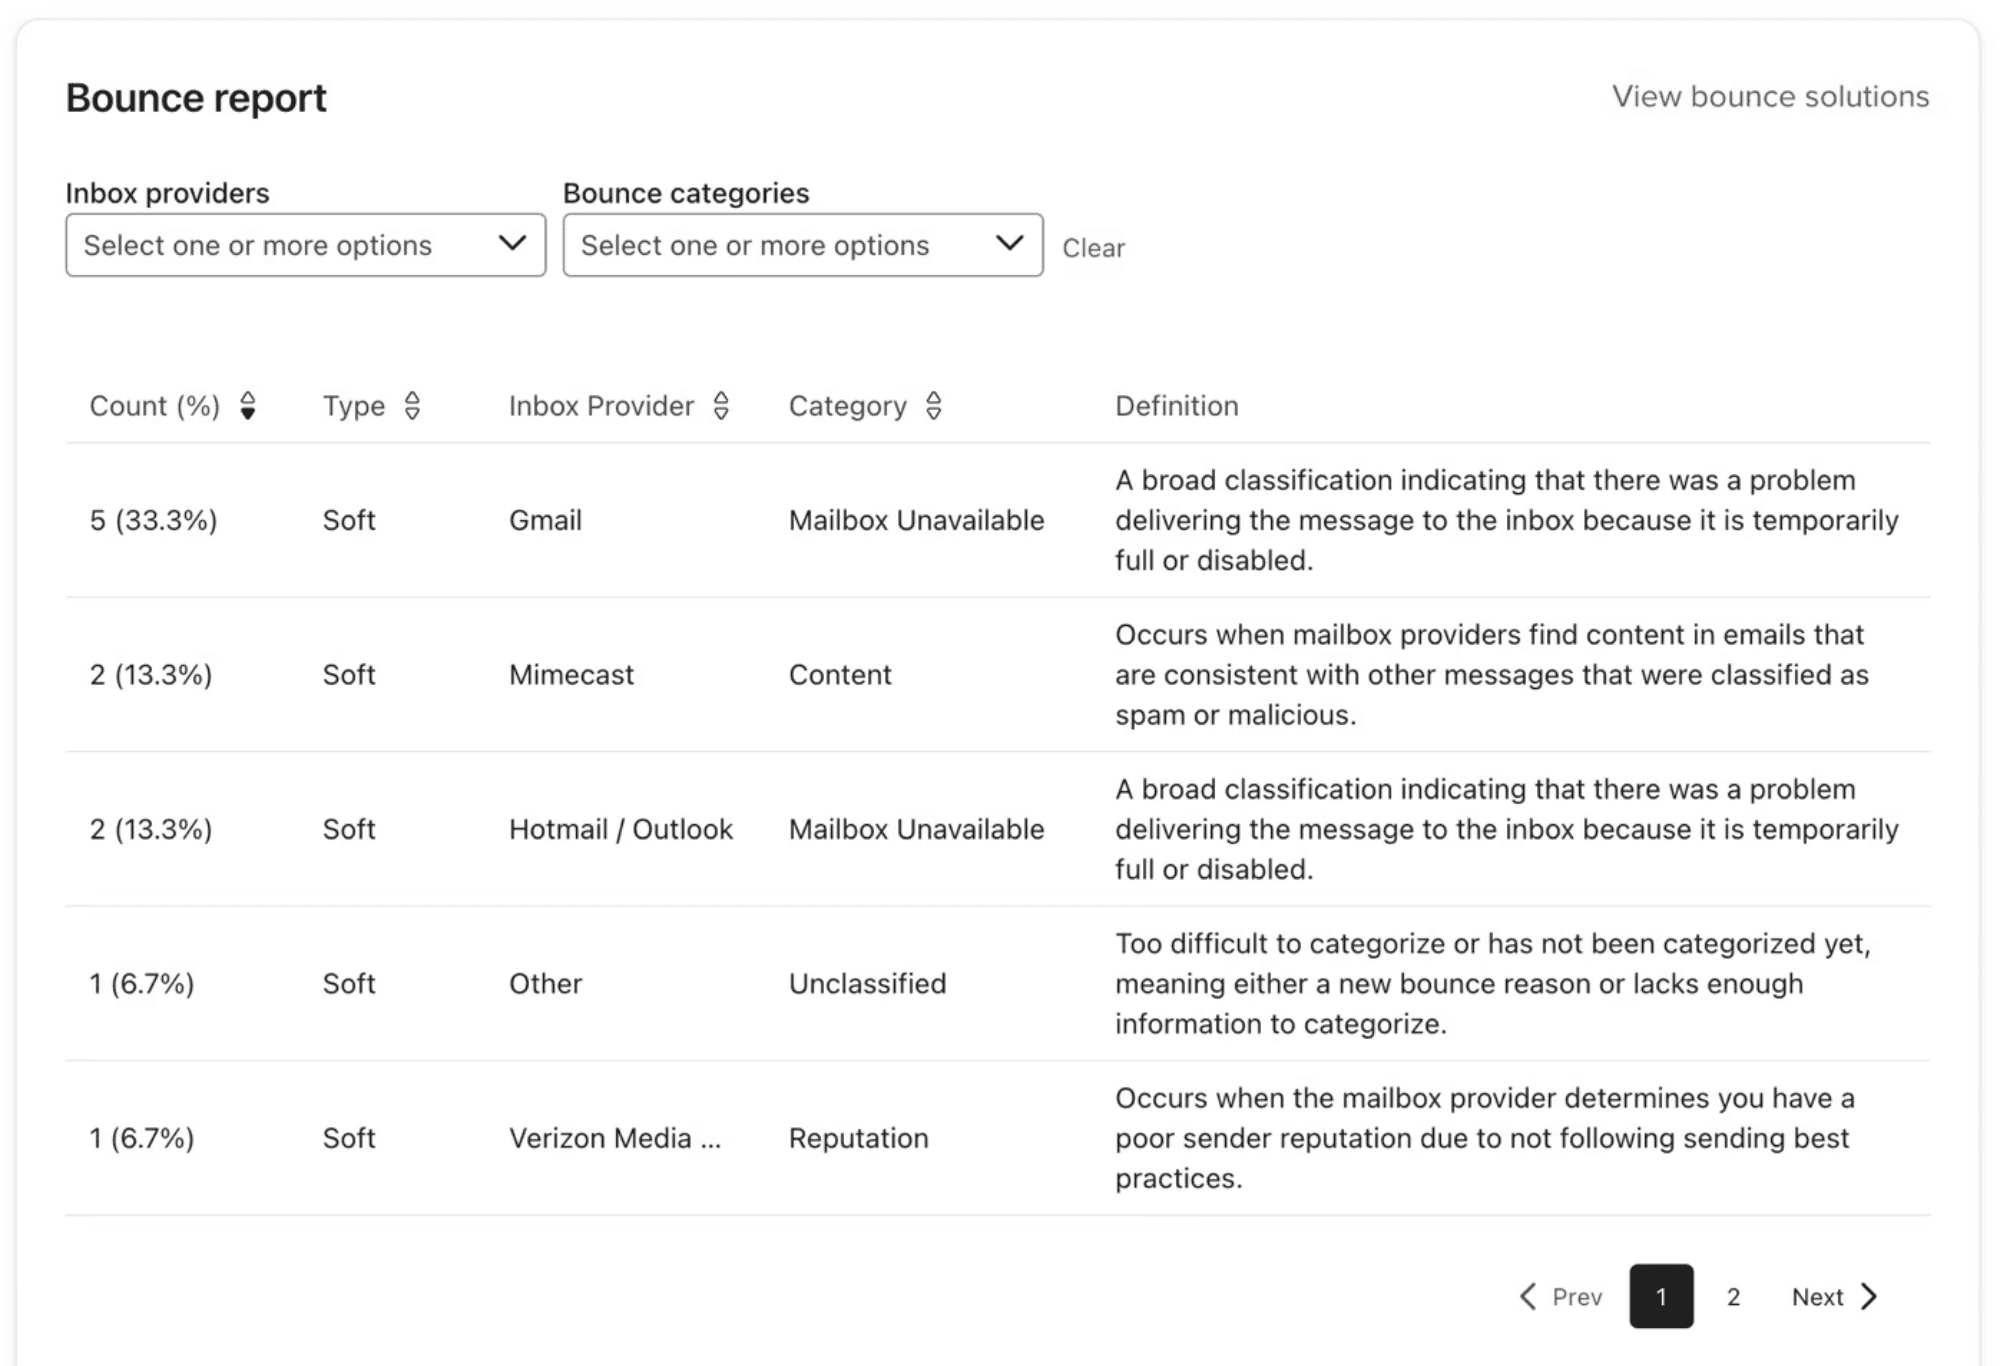
Description: The Bounce Details section breaks down the types and reasons for email bounces, helping you to identify and address issues that prevent your emails from reaching their intended recipients.
The key insight here is the ability to monitor bounces across various platforms and understand the reasons behind them. This feature is particularly helpful when there’s a noticeable increase in bounces from a specific email service provider (ESP), allowing you to quickly identify and address any issues.
Usage: By understanding the reasons behind email bounces, you can take steps to clean your email list, removing invalid addresses and resolving issues that lead to soft bounces. Regularly monitoring bounce details helps maintain a healthy email list and improves overall deliverability.
Key Features:
Hard Bounces: Provides details on permanent issues, such as invalid email addresses, that prevent delivery.
Soft Bounces: Offers insights into temporary issues, such as a full inbox or temporary server issues, that might cause an email to bounce.
Bounce Rate Tracking: Shows the overall bounce rate and trends over time.
Source: Klaviyo
Key Metrics for DTC E-Commerce Brands
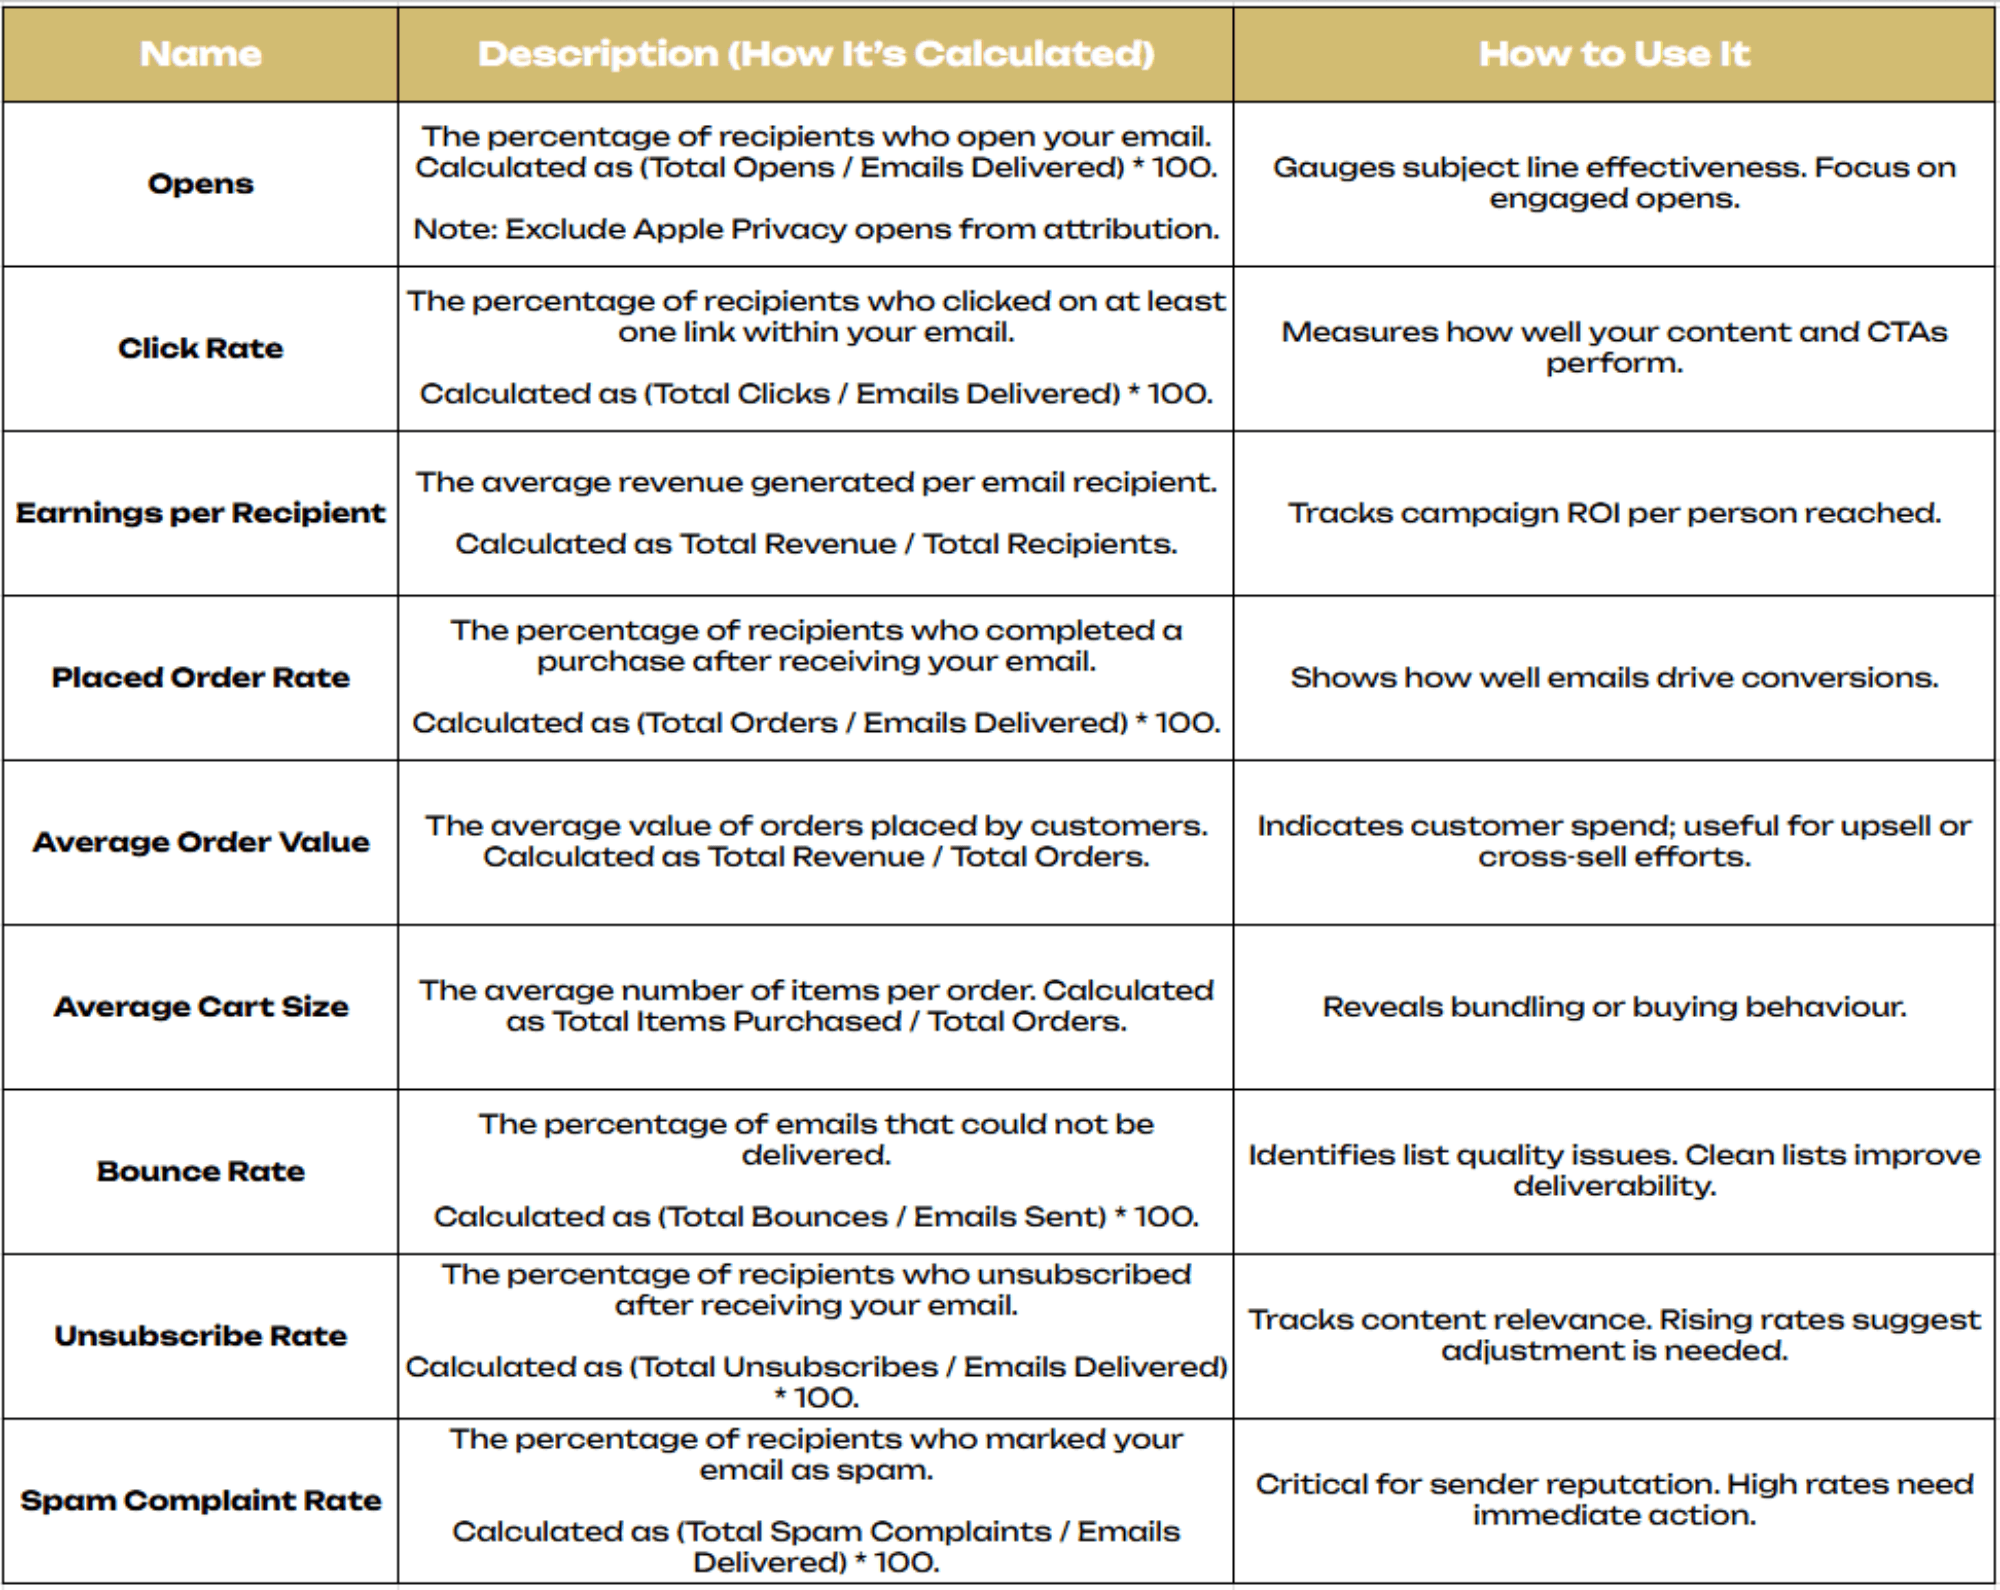
For DTC brands, particularly in fashion, supplements, and F&B industries, tracking the right metrics is essential for optimising marketing strategies. The following table outlines key metrics, how they are calculated, and how they can be used to drive better business outcomes.
Best Practices for Interpreting Klaviyo Data
Interpreting Klaviyo data accurately is crucial for making informed decisions that enhance your marketing performance. Here are some best practices to help you navigate and utilise your data effectively:
Use Benchmarking Data: Comparing your performance against industry benchmarks can provide valuable context to your metrics. Use this data to set realistic goals and identify areas where you need to improve. For example, if your open rates are below the industry average, it may be time to test new subject lines or send times.
Avoid Common Reporting Errors: One common mistake is over-relying on a single metric, such as open rates—our guide on 8 Proven Strategies to Boost Your Open Rates can help improve underperforming campaigns.
Ensure Data Accuracy and Consistency: Regularly audit your data to ensure it’s accurate and up-to-date. Inconsistent or outdated data can lead to misguided strategies and missed opportunities. This includes checking for discrepancies in reporting and making sure your data sources are reliable.
Conclusion
As digital marketing continues to evolve, so too does the importance of accurate and insightful reporting. Emerging trends in portfolio reporting, such as predictive analytics and AI-driven insights, are set to revolutionise how DTC brands approach their marketing strategies. By staying ahead of these trends and fully utilising Klaviyo’s robust reporting tools—including features like Predictive Analytics and AI-powered segmentation—brands can continue to refine their approach.
Ready to take your Klaviyo reporting to the next level?
Start implementing these strategies today to drive higher engagement and sales for your DTC brand. If you’re looking for personalised advice on how to optimise your Klaviyo setup, click here to schedule a free consultation with our experts and unlock your brand’s full potential!
The Importance of Reporting in Klaviyo
In today’s competitive e-commerce landscape, data-driven decision-making is not just an advantage—it’s a necessity. For DTC brands in the fashion, supplements, and F&B industries, effective reporting in Klaviyo plays a crucial role in optimising email and SMS campaigns.
Portfolio reporting allows you to track key performance metrics, identify trends, and make informed decisions that drive revenue and enhance customer retention.
By leveraging Klaviyo’s robust reporting tools, businesses can gain deeper insights into their marketing efforts and fine-tune their strategies to maximise results.
Understanding Klaviyo’s Reporting Tools
Klaviyo provides a suite of reporting tools designed to help DTC brands monitor performance across multiple channels. The platform’s dashboard offers a real-time snapshot of your email and SMS campaigns, while detailed reports allow for deeper analysis of key metrics.
For brands in fashion, supplements, and F&B industries, these tools are invaluable for tracking customer engagement, sales performance, and overall marketing effectiveness. The ability to customise reports and visualise data ensures that you can quickly identify areas of success and opportunities for improvement.
Klaviyo’s Analytics Tab: Maximising the Dashboard, Benchmarks, and Deliverability Tools
1. Dashboard Overview
The Klaviyo Dashboard serves as your marketing command centre, offering a comprehensive view of your key performance metrics. This tool is designed for quick and effective monitoring of your overall marketing performance, enabling you to make real-time adjustments as needed.

Source: Klaviyo
Conversion Summary
Description: The Conversion Summary provides a high-level overview of the effectiveness of your email and SMS campaigns in driving conversions. This summary includes key metrics like placed order rate, revenue generated, and conversion rate, giving you a snapshot of how well your marketing efforts are turning leads into customers.
Usage: Use the Conversion Summary to quickly assess the overall performance of your campaigns and identify areas where you may need to optimise. This section helps you understand the direct impact of your marketing activities on sales, enabling data-driven decision-making to boost conversions.
Key Features:
Flows Revenue Contribution: Flows data encompasses all active, manually triggered, and draft flows that were sent during the selected date range.
Campaigns Revenue Contribution: Campaign data consists of all email and SMS campaign messages that were sent within the chosen date range.


Source: Klaviyo
Campaign Performance
Description: The Campaign Performance section tracks and displays key metrics for your recent email and SMS campaigns. This includes open rates, click-through rates, and conversion rates, allowing you to gauge the effectiveness of each campaign at a glance.
Usage: This section is essential for monitoring how well individual campaigns are performing. By comparing the metrics across different campaigns, you can identify which strategies resonate most with your audience—like those outlined in our 15 Email Marketing Campaign Examples—and refine your approach accordingly.
Key Features:
Open Rates: The percentage of recipients who open your email.
Click-Through Rates (CTR): The percentage of recipients who click on links within your email.
Placed Order Rate: Percentage of recipients who made a purchase after engaging with your emails or SMS.

Source: Klaviyo
Campaign Performance Detail
Description: The Campaign Performance Detail provides a more granular analysis of each campaign, breaking down performance metrics by segments, links clicked, and revenue generated. It allows you to dig deeper into the specifics of what’s working and what’s not in your email and SMS marketing.
Usage: Use the Campaign Performance Detail to analyse the finer points of your campaign’s success. This can help you identify which segments are most engaged, which content or offers are driving clicks, and where you might need to adjust your strategy for better results.
Key Features:
Recipients: This refers to the total number of emails or SMS messages that were either successfully received or bounced. For SMS, it includes messages that were sent but failed to deliver.
Delivered: This metric indicates the percentage of messages that successfully landed in your subscribers' inboxes or reached their devices.
Unique Opens: This is the number of individual recipients who opened your email or SMS message, divided by the total number of recipients. Keep in mind that SMS opens cannot be tracked.
Unique Clicks: This measures the number of unique recipients who clicked a link within your email or SMS message, compared to the total number of recipients.
Unique Orders: This rate reflects the number of distinct orders placed as a result of your email or SMS campaigns.
Revenue: This metric calculates the total revenue generated from conversions attributed to your campaigns.
Revenue per Recipient (Rev/Rec): This shows the average revenue generated per recipient, calculated by dividing the total revenue from a campaign by the number of successfully delivered messages.


Flows Performance
Description: The Flows Performance section tracks the effectiveness of your automated workflows (flows) in Klaviyo, such as welcome series, abandoned cart reminders, and post-purchase follow-ups. It displays key metrics like open rates, click-through rates, and revenue generated by each flow.
Usage: This section is critical for understanding how well your automated flows—such as those outlined in 8 Essential Klaviyo Flows to Boost Customer Loyalty—are performing.By monitoring their performance, you can ensure that your automated marketing efforts are continuously driving engagement and conversions.
Key Features:
Open Rate: The open rate represents the percentage of recipients who opened your email out of the total emails delivered. It is calculated by dividing the number of opens by the total number of delivered emails.
Click Rate: Click rate is the percentage of recipients who clicked on a link in your email, calculated by dividing the total number of clicks by the number of successfully received emails.
Placed Order Rate: The placed order rate measures the percentage of recipients who made a purchase after receiving your message, calculated by dividing the number of orders placed during the attribution window by the total number of unique recipients of that message.

Source: Klaviyo
Flows Performance Details
Description: Flows Performance Details offers an in-depth analysis of each flow, similar to the Campaign Performance Detail. This includes breakdowns by step, segment performance, and revenue attribution, providing a comprehensive view of how each flow contributes to your overall marketing goals.
Usage: This detailed analysis is useful for optimising individual steps within your flows. By understanding how each step and segment performs, you can refine your flows to maximise engagement and conversions.
Key Features:
Recipients: This figure represents the total number of emails sent, including both those that were successfully delivered and those that bounced. For SMS, it includes messages that were delivered as well as those that failed to reach recipients.
Delivered: This metric reflects the percentage of flow messages that successfully landed in recipients' inboxes or reached their devices.
Unique Opens: This is the number of individual recipients who opened your email, divided by the total number of recipients. Note that open tracking is not available for SMS messages.
Unique Orders: This metric shows the number of unique orders placed as a direct result of your flows.
Revenue: This figure represents the total revenue generated from conversions that were attributed to your email or SMS flow.
Revenue per Recipient (Rev/Rec): This value indicates the average revenue generated per recipient, calculated by dividing the total revenue by the number of successfully delivered messages in a flow.

Source: Klaviyo
Performance Highlights
Description: The Performance Highlights section summarises the top-performing elements of your marketing strategy, including best-performing campaigns, flows, and emails. It provides a quick overview of what’s driving the most success in your Klaviyo account.
Usage: Use Performance Highlights to quickly identify what’s working best in your marketing efforts. This section is ideal for understanding the high-impact elements of your strategy so you can replicate success in future campaigns.
Key Features:
Top Performing Metrics: Top-performing metrics show strong campaign success; examples are low unsubscribe and spam complaint rates and positive revenue results.
Bottom-Performing Metrics: Bottom-performing metrics highlight areas for improvement; examples are high bounce rates, low click-through rates, and lower engagement levels like open rates.

Source: Klaviyo
Email Deliverability
Description: The Email Deliverability section focuses on the health of your email campaigns, ensuring that your messages reach your audience’s inboxes. This section includes metrics such as bounce rates, spam complaints, and inbox placement.
Usage: Regularly monitor the Email Deliverability section to maintain a strong sender reputation and ensure that your emails are being delivered effectively. Issues like high bounce rates or spam complaints can negatively impact your deliverability—check out our step-by-step deliverability checklist to ensure your emails reach inboxes reliably.
Key Features:
Bounce Rate: The bounce rate is the percentage of emails that failed to be delivered, calculated by dividing the number of bounced emails by the total number of emails sent and received.
Spam Rate: The spam rate measures the percentage of recipients who flagged your email as spam, calculated by dividing the number of spam complaints by the total number of delivered emails.
Unsubscribe Rate: The unsubscribe rate reflects the percentage of recipients who opted out of your email list, calculated by dividing the number of unsubscribes by the total number of emails delivered.

Source: Klaviyo
2. Benchmarks Tab
The Benchmark Tab in Klaviyo provides critical insights that allow you to measure your business performance against industry standards. By comparing your performance across key areas such as email campaigns, SMS campaigns, flows, and signup forms, you can identify strengths and areas for improvement.
Overview
Description: The Benchmark Overview gives a snapshot of how your overall business performance compares to similar businesses in your industry. It provides a quick, at-a-glance view of your standing, helping you to understand where you excel and where there’s room for improvement.
Usage: Use this section to gain a high-level understanding of how your business is performing in the market. It helps you quickly assess whether your marketing strategies are competitive and identify any broad areas that need attention.
Key Features:
Industry Comparison: Measures your business metrics against similar businesses within your industry.
Performance Ratings: Assigns ratings (e.g., "Fair," "Good," "Excellent") to different aspects of your marketing efforts based on how you compare to industry standards.

Source: Klaviyo
Business Performance
Description: This section provides a detailed analysis of your business's overall performance, including revenue generation, customer growth, and engagement metrics. It compares these metrics against those of similar companies in your industry.
Usage: This section is vital for understanding the broader success of your business. Regularly reviewing these metrics can help you maintain a competitive edge by ensuring that your business performance meets or exceeds industry standards.
Key Features:
Metric: These are key indicators selected to evaluate your account’s performance, such as open rate, click rate, and repeat customer rate.
Performance: This reflects how well each metric compares to your peer group, rated as poor, fair, good, or excellent. It helps gauge where you stand against industry benchmarks.
Your Value: The actual figure corresponding to your performance metric, such as your average order value in monetary terms.
Your Percentile: Shows how your performance ranks relative to other companies in your peer group, with percentiles indicating your standing (e.g., 75th percentile means you outperform 75% of your peers).
25th Percentile: Represents the performance of companies in the lowest quarter of your peer group.
Peer Median: This is the average performance level of companies in your peer group, where half of the companies perform better and half perform worse.
75th Percentile: This represents the performance of companies in the highest quarter of your peer group, indicating strong performance.


Source: Klaviyo
Email Campaign Performance
Description: The Email Campaign Performance section provides benchmarks specific to your email marketing efforts. It compares key metrics such as open rates, click-through rates, and conversion rates against industry averages.
Usage: Use this section to pinpoint areas where your email campaigns might be underperforming. Understanding how your email metrics compare to industry averages can guide optimisations that improve overall campaign effectiveness.
Performance indicators and values:
Open Rate: The percentage of recipients who open your email compared to the total number of people who received it.
Click Rate: The percentage of recipients who click a link in your email, based on the total number of emails delivered.
Click-Through Rate: The percentage of recipients who click a link in your email out of those who opened it.
Conversion Rate: The percentage of recipients who place an order after interacting with your email, based on the total number of emails sent.
Email Revenue Per Recipient: The average revenue generated per recipient, calculated by dividing the total email-attributed revenue by the number of people who received an email in a specific time period.

Source: Klaviyo
SMS Campaign Performance
Description: This section focuses on the performance of your SMS marketing campaigns, comparing metrics like engagement rates, click-through rates, and conversion rates against industry standards.
Usage: SMS marketing is increasingly important, especially for DTC brands. This section helps you ensure that your SMS campaigns are competitive and effective, allowing you to make data-driven decisions to enhance your SMS strategy.
Performance indicators and values:
Click Rate: The percentage of recipients who click a link in your SMS, based on the total number of SMS messages delivered.
Placed Order Rate: The percentage of recipients who place an order after clicking a link in your SMS, calculated out of the total number of people who received the SMS.
SMS Revenue Per Recipient: The average revenue generated per recipient, determined by dividing the total SMS-attributed revenue by the number of recipients who received the SMS during a specific period.
Unsubscribe Rate: The percentage of recipients who opt out of your SMS list, based on the total number of SMS messages delivered.

Source: Klaviyo
Flow Performance
Description: The Flow Performance section provides benchmarks for your automated email and SMS flows. It compares the performance of these flows, including open rates, click-through rates, and conversion rates, to industry standards.
Usage: Automated flows are critical for sustained engagement and conversions. Regularly comparing your flow performance against industry benchmarks ensures that your automation strategies are optimised for success.
Key Features:
Metric: The metrics shown reflect your account's performance, such as open rate, click rate, and placed order rate.
Your Performance: Indicates how well your metrics compare to your peer group, categorised as Poor, Fair, Good, or Excellent. For more details on these statuses and tips for improvement, check out the "How to improve your benchmark results" guide.
Your Value: This represents the actual figure associated with a specific performance metric, such as the exact average order value for your business.
Median (Peers): This is the performance value of companies in the middle range, where half perform better and half perform worse than the median.
Performance indicators and values:
Open Rate: The percentage of recipients who open your email out of the total number of emails delivered.
Click Rate: The percentage of recipients who click a link in your email, based on the total number of emails received.
Click-Through Rate: The percentage of recipients who click a link in your email out of those who opened it.
Conversion Rate: The percentage of recipients who make a purchase after engaging with your email, calculated from the total number of people who received the email.
Email Revenue Per Recipient: The average revenue generated per email recipient, calculated by dividing the total revenue attributed to email by the number of recipients within a given timeframe.
Spam Report Rate: The percentage of recipients who mark your email as spam out of the total number of people who received it.
Unsubscribe Rate: The percentage of recipients who opt out of your email list, based on the total number of emails delivered.
Bounce Rate: The percentage of emails that fail to be delivered (bounced) out of the total number of emails sent.

Source: Klaviyo
Signup Forms Performance
Description: The Signup Forms Performance section benchmarks the effectiveness of your forms in converting visitors into subscribers. It compares metrics such as conversion rates and growth rates against those of similar businesses.
Usage: Optimising your signup forms is crucial for growing your email list. This section helps you understand how well your forms are performing compared to industry benchmarks—see our Top 8 Klaviyo Pop-Up Form Strategies to maximise conversion potential.

Source: Klaviyo
3. Deliverability Tab
Klaviyo’s Deliverability Tab provides essential insights into the health of your email campaigns, ensuring that your emails reach your audience effectively. This section is broken down into three key components: Score, Reports, and Bounce Details.
Score
Description: The Score section gives you an overall deliverability score, which serves as an indicator of how well your emails are performing in terms of deliverability. This score takes into account various factors like bounce rates, spam complaints, and inbox placement to provide a comprehensive view of your sender reputation.
Usage: Regularly monitoring your deliverability score allows you to maintain a strong sender reputation. A high score suggests that your emails are reaching inboxes effectively, while a lower score indicates potential issues that need to be addressed to prevent emails from landing in spam folders.
Key Features:
Deliverability Score: A composite score based on multiple deliverability factors such as bounce rates, spam complaints, and engagement metrics.
Reputation Indicators: Highlights specific areas that are positively or negatively impacting your score.


Source: Klaviyo
Reports
Description: The Reports section offers detailed insights into the performance of your email campaigns over time, focusing specifically on deliverability metrics. It provides data on how your emails are being received by your audience, including inbox placement, spam rates, and engagement.
Usage: This section is crucial for understanding the specific factors that affect your email deliverability. By reviewing these reports, you can identify trends and potential issues, such as increasing spam complaints or declining inbox placement, allowing you to take corrective action before they impact your overall campaign performance.
Key Features:
Email Send Volume: The Email Send Volume report provides a breakdown of both delivered and bounced emails, focusing on the top 5 email domains or inbox providers with the highest number of sent emails.
Negative Engagement Metrics: The Negative Engagement Metrics chart displays the rates of negative interactions, such as bounces or spam reports, across the top 5 email domains or inbox providers with the most sent emails on your account.
Positive Engagement Metrics: The Positive Engagement Metrics chart highlights the rates of favourable interactions, like opens and clicks, for the top 5 email domains or inbox providers with the highest email send volume.


Source: Klaviyo
Bounce Details
Description: The Bounce Details section breaks down the types and reasons for email bounces, helping you to identify and address issues that prevent your emails from reaching their intended recipients.
The key insight here is the ability to monitor bounces across various platforms and understand the reasons behind them. This feature is particularly helpful when there’s a noticeable increase in bounces from a specific email service provider (ESP), allowing you to quickly identify and address any issues.
Usage: By understanding the reasons behind email bounces, you can take steps to clean your email list, removing invalid addresses and resolving issues that lead to soft bounces. Regularly monitoring bounce details helps maintain a healthy email list and improves overall deliverability.
Key Features:
Hard Bounces: Provides details on permanent issues, such as invalid email addresses, that prevent delivery.
Soft Bounces: Offers insights into temporary issues, such as a full inbox or temporary server issues, that might cause an email to bounce.
Bounce Rate Tracking: Shows the overall bounce rate and trends over time.


Source: Klaviyo
Key Metrics for DTC E-Commerce Brands
For DTC brands, particularly in fashion, supplements, and F&B industries, tracking the right metrics is essential for optimising marketing strategies. The following table outlines key metrics, how they are calculated, and how they can be used to drive better business outcomes.

Best Practices for Interpreting Klaviyo Data
Interpreting Klaviyo data accurately is crucial for making informed decisions that enhance your marketing performance. Here are some best practices to help you navigate and utilise your data effectively:
Use Benchmarking Data: Comparing your performance against industry benchmarks can provide valuable context to your metrics. Use this data to set realistic goals and identify areas where you need to improve. For example, if your open rates are below the industry average, it may be time to test new subject lines or send times.
Avoid Common Reporting Errors: One common mistake is over-relying on a single metric, such as open rates—our guide on 8 Proven Strategies to Boost Your Open Rates can help improve underperforming campaigns.
Ensure Data Accuracy and Consistency: Regularly audit your data to ensure it’s accurate and up-to-date. Inconsistent or outdated data can lead to misguided strategies and missed opportunities. This includes checking for discrepancies in reporting and making sure your data sources are reliable.
Conclusion
As digital marketing continues to evolve, so too does the importance of accurate and insightful reporting. Emerging trends in portfolio reporting, such as predictive analytics and AI-driven insights, are set to revolutionise how DTC brands approach their marketing strategies. By staying ahead of these trends and fully utilising Klaviyo’s robust reporting tools—including features like Predictive Analytics and AI-powered segmentation—brands can continue to refine their approach.
Ready to take your Klaviyo reporting to the next level?
Start implementing these strategies today to drive higher engagement and sales for your DTC brand. If you’re looking for personalised advice on how to optimise your Klaviyo setup, click here to schedule a free consultation with our experts and unlock your brand’s full potential!
Unlock the full power of Klaviyo’s reporting. Learn to interpret key metrics, benchmark performance, and optimise DTC email & SMS campaigns for growth.
The Importance of Reporting in Klaviyo
In today’s competitive e-commerce landscape, data-driven decision-making is not just an advantage—it’s a necessity. For DTC brands in the fashion, supplements, and F&B industries, effective reporting in Klaviyo plays a crucial role in optimising email and SMS campaigns.
Portfolio reporting allows you to track key performance metrics, identify trends, and make informed decisions that drive revenue and enhance customer retention.
By leveraging Klaviyo’s robust reporting tools, businesses can gain deeper insights into their marketing efforts and fine-tune their strategies to maximise results.
Understanding Klaviyo’s Reporting Tools
Klaviyo provides a suite of reporting tools designed to help DTC brands monitor performance across multiple channels. The platform’s dashboard offers a real-time snapshot of your email and SMS campaigns, while detailed reports allow for deeper analysis of key metrics.
For brands in fashion, supplements, and F&B industries, these tools are invaluable for tracking customer engagement, sales performance, and overall marketing effectiveness. The ability to customise reports and visualise data ensures that you can quickly identify areas of success and opportunities for improvement.
Klaviyo’s Analytics Tab: Maximising the Dashboard, Benchmarks, and Deliverability Tools
1. Dashboard Overview
The Klaviyo Dashboard serves as your marketing command centre, offering a comprehensive view of your key performance metrics. This tool is designed for quick and effective monitoring of your overall marketing performance, enabling you to make real-time adjustments as needed.

Source: Klaviyo
Conversion Summary
Description: The Conversion Summary provides a high-level overview of the effectiveness of your email and SMS campaigns in driving conversions. This summary includes key metrics like placed order rate, revenue generated, and conversion rate, giving you a snapshot of how well your marketing efforts are turning leads into customers.
Usage: Use the Conversion Summary to quickly assess the overall performance of your campaigns and identify areas where you may need to optimise. This section helps you understand the direct impact of your marketing activities on sales, enabling data-driven decision-making to boost conversions.
Key Features:
Flows Revenue Contribution: Flows data encompasses all active, manually triggered, and draft flows that were sent during the selected date range.
Campaigns Revenue Contribution: Campaign data consists of all email and SMS campaign messages that were sent within the chosen date range.


Source: Klaviyo
Campaign Performance
Description: The Campaign Performance section tracks and displays key metrics for your recent email and SMS campaigns. This includes open rates, click-through rates, and conversion rates, allowing you to gauge the effectiveness of each campaign at a glance.
Usage: This section is essential for monitoring how well individual campaigns are performing. By comparing the metrics across different campaigns, you can identify which strategies resonate most with your audience—like those outlined in our 15 Email Marketing Campaign Examples—and refine your approach accordingly.
Key Features:
Open Rates: The percentage of recipients who open your email.
Click-Through Rates (CTR): The percentage of recipients who click on links within your email.
Placed Order Rate: Percentage of recipients who made a purchase after engaging with your emails or SMS.

Source: Klaviyo
Campaign Performance Detail
Description: The Campaign Performance Detail provides a more granular analysis of each campaign, breaking down performance metrics by segments, links clicked, and revenue generated. It allows you to dig deeper into the specifics of what’s working and what’s not in your email and SMS marketing.
Usage: Use the Campaign Performance Detail to analyse the finer points of your campaign’s success. This can help you identify which segments are most engaged, which content or offers are driving clicks, and where you might need to adjust your strategy for better results.
Key Features:
Recipients: This refers to the total number of emails or SMS messages that were either successfully received or bounced. For SMS, it includes messages that were sent but failed to deliver.
Delivered: This metric indicates the percentage of messages that successfully landed in your subscribers' inboxes or reached their devices.
Unique Opens: This is the number of individual recipients who opened your email or SMS message, divided by the total number of recipients. Keep in mind that SMS opens cannot be tracked.
Unique Clicks: This measures the number of unique recipients who clicked a link within your email or SMS message, compared to the total number of recipients.
Unique Orders: This rate reflects the number of distinct orders placed as a result of your email or SMS campaigns.
Revenue: This metric calculates the total revenue generated from conversions attributed to your campaigns.
Revenue per Recipient (Rev/Rec): This shows the average revenue generated per recipient, calculated by dividing the total revenue from a campaign by the number of successfully delivered messages.


Flows Performance
Description: The Flows Performance section tracks the effectiveness of your automated workflows (flows) in Klaviyo, such as welcome series, abandoned cart reminders, and post-purchase follow-ups. It displays key metrics like open rates, click-through rates, and revenue generated by each flow.
Usage: This section is critical for understanding how well your automated flows—such as those outlined in 8 Essential Klaviyo Flows to Boost Customer Loyalty—are performing.By monitoring their performance, you can ensure that your automated marketing efforts are continuously driving engagement and conversions.
Key Features:
Open Rate: The open rate represents the percentage of recipients who opened your email out of the total emails delivered. It is calculated by dividing the number of opens by the total number of delivered emails.
Click Rate: Click rate is the percentage of recipients who clicked on a link in your email, calculated by dividing the total number of clicks by the number of successfully received emails.
Placed Order Rate: The placed order rate measures the percentage of recipients who made a purchase after receiving your message, calculated by dividing the number of orders placed during the attribution window by the total number of unique recipients of that message.

Source: Klaviyo
Flows Performance Details
Description: Flows Performance Details offers an in-depth analysis of each flow, similar to the Campaign Performance Detail. This includes breakdowns by step, segment performance, and revenue attribution, providing a comprehensive view of how each flow contributes to your overall marketing goals.
Usage: This detailed analysis is useful for optimising individual steps within your flows. By understanding how each step and segment performs, you can refine your flows to maximise engagement and conversions.
Key Features:
Recipients: This figure represents the total number of emails sent, including both those that were successfully delivered and those that bounced. For SMS, it includes messages that were delivered as well as those that failed to reach recipients.
Delivered: This metric reflects the percentage of flow messages that successfully landed in recipients' inboxes or reached their devices.
Unique Opens: This is the number of individual recipients who opened your email, divided by the total number of recipients. Note that open tracking is not available for SMS messages.
Unique Orders: This metric shows the number of unique orders placed as a direct result of your flows.
Revenue: This figure represents the total revenue generated from conversions that were attributed to your email or SMS flow.
Revenue per Recipient (Rev/Rec): This value indicates the average revenue generated per recipient, calculated by dividing the total revenue by the number of successfully delivered messages in a flow.

Source: Klaviyo
Performance Highlights
Description: The Performance Highlights section summarises the top-performing elements of your marketing strategy, including best-performing campaigns, flows, and emails. It provides a quick overview of what’s driving the most success in your Klaviyo account.
Usage: Use Performance Highlights to quickly identify what’s working best in your marketing efforts. This section is ideal for understanding the high-impact elements of your strategy so you can replicate success in future campaigns.
Key Features:
Top Performing Metrics: Top-performing metrics show strong campaign success; examples are low unsubscribe and spam complaint rates and positive revenue results.
Bottom-Performing Metrics: Bottom-performing metrics highlight areas for improvement; examples are high bounce rates, low click-through rates, and lower engagement levels like open rates.

Source: Klaviyo
Email Deliverability
Description: The Email Deliverability section focuses on the health of your email campaigns, ensuring that your messages reach your audience’s inboxes. This section includes metrics such as bounce rates, spam complaints, and inbox placement.
Usage: Regularly monitor the Email Deliverability section to maintain a strong sender reputation and ensure that your emails are being delivered effectively. Issues like high bounce rates or spam complaints can negatively impact your deliverability—check out our step-by-step deliverability checklist to ensure your emails reach inboxes reliably.
Key Features:
Bounce Rate: The bounce rate is the percentage of emails that failed to be delivered, calculated by dividing the number of bounced emails by the total number of emails sent and received.
Spam Rate: The spam rate measures the percentage of recipients who flagged your email as spam, calculated by dividing the number of spam complaints by the total number of delivered emails.
Unsubscribe Rate: The unsubscribe rate reflects the percentage of recipients who opted out of your email list, calculated by dividing the number of unsubscribes by the total number of emails delivered.

Source: Klaviyo
2. Benchmarks Tab
The Benchmark Tab in Klaviyo provides critical insights that allow you to measure your business performance against industry standards. By comparing your performance across key areas such as email campaigns, SMS campaigns, flows, and signup forms, you can identify strengths and areas for improvement.
Overview
Description: The Benchmark Overview gives a snapshot of how your overall business performance compares to similar businesses in your industry. It provides a quick, at-a-glance view of your standing, helping you to understand where you excel and where there’s room for improvement.
Usage: Use this section to gain a high-level understanding of how your business is performing in the market. It helps you quickly assess whether your marketing strategies are competitive and identify any broad areas that need attention.
Key Features:
Industry Comparison: Measures your business metrics against similar businesses within your industry.
Performance Ratings: Assigns ratings (e.g., "Fair," "Good," "Excellent") to different aspects of your marketing efforts based on how you compare to industry standards.

Source: Klaviyo
Business Performance
Description: This section provides a detailed analysis of your business's overall performance, including revenue generation, customer growth, and engagement metrics. It compares these metrics against those of similar companies in your industry.
Usage: This section is vital for understanding the broader success of your business. Regularly reviewing these metrics can help you maintain a competitive edge by ensuring that your business performance meets or exceeds industry standards.
Key Features:
Metric: These are key indicators selected to evaluate your account’s performance, such as open rate, click rate, and repeat customer rate.
Performance: This reflects how well each metric compares to your peer group, rated as poor, fair, good, or excellent. It helps gauge where you stand against industry benchmarks.
Your Value: The actual figure corresponding to your performance metric, such as your average order value in monetary terms.
Your Percentile: Shows how your performance ranks relative to other companies in your peer group, with percentiles indicating your standing (e.g., 75th percentile means you outperform 75% of your peers).
25th Percentile: Represents the performance of companies in the lowest quarter of your peer group.
Peer Median: This is the average performance level of companies in your peer group, where half of the companies perform better and half perform worse.
75th Percentile: This represents the performance of companies in the highest quarter of your peer group, indicating strong performance.


Source: Klaviyo
Email Campaign Performance
Description: The Email Campaign Performance section provides benchmarks specific to your email marketing efforts. It compares key metrics such as open rates, click-through rates, and conversion rates against industry averages.
Usage: Use this section to pinpoint areas where your email campaigns might be underperforming. Understanding how your email metrics compare to industry averages can guide optimisations that improve overall campaign effectiveness.
Performance indicators and values:
Open Rate: The percentage of recipients who open your email compared to the total number of people who received it.
Click Rate: The percentage of recipients who click a link in your email, based on the total number of emails delivered.
Click-Through Rate: The percentage of recipients who click a link in your email out of those who opened it.
Conversion Rate: The percentage of recipients who place an order after interacting with your email, based on the total number of emails sent.
Email Revenue Per Recipient: The average revenue generated per recipient, calculated by dividing the total email-attributed revenue by the number of people who received an email in a specific time period.

Source: Klaviyo
SMS Campaign Performance
Description: This section focuses on the performance of your SMS marketing campaigns, comparing metrics like engagement rates, click-through rates, and conversion rates against industry standards.
Usage: SMS marketing is increasingly important, especially for DTC brands. This section helps you ensure that your SMS campaigns are competitive and effective, allowing you to make data-driven decisions to enhance your SMS strategy.
Performance indicators and values:
Click Rate: The percentage of recipients who click a link in your SMS, based on the total number of SMS messages delivered.
Placed Order Rate: The percentage of recipients who place an order after clicking a link in your SMS, calculated out of the total number of people who received the SMS.
SMS Revenue Per Recipient: The average revenue generated per recipient, determined by dividing the total SMS-attributed revenue by the number of recipients who received the SMS during a specific period.
Unsubscribe Rate: The percentage of recipients who opt out of your SMS list, based on the total number of SMS messages delivered.

Source: Klaviyo
Flow Performance
Description: The Flow Performance section provides benchmarks for your automated email and SMS flows. It compares the performance of these flows, including open rates, click-through rates, and conversion rates, to industry standards.
Usage: Automated flows are critical for sustained engagement and conversions. Regularly comparing your flow performance against industry benchmarks ensures that your automation strategies are optimised for success.
Key Features:
Metric: The metrics shown reflect your account's performance, such as open rate, click rate, and placed order rate.
Your Performance: Indicates how well your metrics compare to your peer group, categorised as Poor, Fair, Good, or Excellent. For more details on these statuses and tips for improvement, check out the "How to improve your benchmark results" guide.
Your Value: This represents the actual figure associated with a specific performance metric, such as the exact average order value for your business.
Median (Peers): This is the performance value of companies in the middle range, where half perform better and half perform worse than the median.
Performance indicators and values:
Open Rate: The percentage of recipients who open your email out of the total number of emails delivered.
Click Rate: The percentage of recipients who click a link in your email, based on the total number of emails received.
Click-Through Rate: The percentage of recipients who click a link in your email out of those who opened it.
Conversion Rate: The percentage of recipients who make a purchase after engaging with your email, calculated from the total number of people who received the email.
Email Revenue Per Recipient: The average revenue generated per email recipient, calculated by dividing the total revenue attributed to email by the number of recipients within a given timeframe.
Spam Report Rate: The percentage of recipients who mark your email as spam out of the total number of people who received it.
Unsubscribe Rate: The percentage of recipients who opt out of your email list, based on the total number of emails delivered.
Bounce Rate: The percentage of emails that fail to be delivered (bounced) out of the total number of emails sent.

Source: Klaviyo
Signup Forms Performance
Description: The Signup Forms Performance section benchmarks the effectiveness of your forms in converting visitors into subscribers. It compares metrics such as conversion rates and growth rates against those of similar businesses.
Usage: Optimising your signup forms is crucial for growing your email list. This section helps you understand how well your forms are performing compared to industry benchmarks—see our Top 8 Klaviyo Pop-Up Form Strategies to maximise conversion potential.

Source: Klaviyo
3. Deliverability Tab
Klaviyo’s Deliverability Tab provides essential insights into the health of your email campaigns, ensuring that your emails reach your audience effectively. This section is broken down into three key components: Score, Reports, and Bounce Details.
Score
Description: The Score section gives you an overall deliverability score, which serves as an indicator of how well your emails are performing in terms of deliverability. This score takes into account various factors like bounce rates, spam complaints, and inbox placement to provide a comprehensive view of your sender reputation.
Usage: Regularly monitoring your deliverability score allows you to maintain a strong sender reputation. A high score suggests that your emails are reaching inboxes effectively, while a lower score indicates potential issues that need to be addressed to prevent emails from landing in spam folders.
Key Features:
Deliverability Score: A composite score based on multiple deliverability factors such as bounce rates, spam complaints, and engagement metrics.
Reputation Indicators: Highlights specific areas that are positively or negatively impacting your score.


Source: Klaviyo
Reports
Description: The Reports section offers detailed insights into the performance of your email campaigns over time, focusing specifically on deliverability metrics. It provides data on how your emails are being received by your audience, including inbox placement, spam rates, and engagement.
Usage: This section is crucial for understanding the specific factors that affect your email deliverability. By reviewing these reports, you can identify trends and potential issues, such as increasing spam complaints or declining inbox placement, allowing you to take corrective action before they impact your overall campaign performance.
Key Features:
Email Send Volume: The Email Send Volume report provides a breakdown of both delivered and bounced emails, focusing on the top 5 email domains or inbox providers with the highest number of sent emails.
Negative Engagement Metrics: The Negative Engagement Metrics chart displays the rates of negative interactions, such as bounces or spam reports, across the top 5 email domains or inbox providers with the most sent emails on your account.
Positive Engagement Metrics: The Positive Engagement Metrics chart highlights the rates of favourable interactions, like opens and clicks, for the top 5 email domains or inbox providers with the highest email send volume.


Source: Klaviyo
Bounce Details
Description: The Bounce Details section breaks down the types and reasons for email bounces, helping you to identify and address issues that prevent your emails from reaching their intended recipients.
The key insight here is the ability to monitor bounces across various platforms and understand the reasons behind them. This feature is particularly helpful when there’s a noticeable increase in bounces from a specific email service provider (ESP), allowing you to quickly identify and address any issues.
Usage: By understanding the reasons behind email bounces, you can take steps to clean your email list, removing invalid addresses and resolving issues that lead to soft bounces. Regularly monitoring bounce details helps maintain a healthy email list and improves overall deliverability.
Key Features:
Hard Bounces: Provides details on permanent issues, such as invalid email addresses, that prevent delivery.
Soft Bounces: Offers insights into temporary issues, such as a full inbox or temporary server issues, that might cause an email to bounce.
Bounce Rate Tracking: Shows the overall bounce rate and trends over time.


Source: Klaviyo
Key Metrics for DTC E-Commerce Brands
For DTC brands, particularly in fashion, supplements, and F&B industries, tracking the right metrics is essential for optimising marketing strategies. The following table outlines key metrics, how they are calculated, and how they can be used to drive better business outcomes.

Best Practices for Interpreting Klaviyo Data
Interpreting Klaviyo data accurately is crucial for making informed decisions that enhance your marketing performance. Here are some best practices to help you navigate and utilise your data effectively:
Use Benchmarking Data: Comparing your performance against industry benchmarks can provide valuable context to your metrics. Use this data to set realistic goals and identify areas where you need to improve. For example, if your open rates are below the industry average, it may be time to test new subject lines or send times.
Avoid Common Reporting Errors: One common mistake is over-relying on a single metric, such as open rates—our guide on 8 Proven Strategies to Boost Your Open Rates can help improve underperforming campaigns.
Ensure Data Accuracy and Consistency: Regularly audit your data to ensure it’s accurate and up-to-date. Inconsistent or outdated data can lead to misguided strategies and missed opportunities. This includes checking for discrepancies in reporting and making sure your data sources are reliable.
Conclusion
As digital marketing continues to evolve, so too does the importance of accurate and insightful reporting. Emerging trends in portfolio reporting, such as predictive analytics and AI-driven insights, are set to revolutionise how DTC brands approach their marketing strategies. By staying ahead of these trends and fully utilising Klaviyo’s robust reporting tools—including features like Predictive Analytics and AI-powered segmentation—brands can continue to refine their approach.
Ready to take your Klaviyo reporting to the next level?
Start implementing these strategies today to drive higher engagement and sales for your DTC brand. If you’re looking for personalised advice on how to optimise your Klaviyo setup, click here to schedule a free consultation with our experts and unlock your brand’s full potential!
Join our newsletter list
Sign up to get the most recent blog articles in your email every week.
Other Blogs
Other Blogs
Check our other project Blogs with useful insight and information for your businesses
Other Blogs
Other Blogs
Check our other project Blogs with useful insight and information for your businesses
Other Blogs
Other Blogs
Check our other project Blogs with useful insight and information for your businesses


